Overview
In the simplest terms, this plugin provides a way for you to monitor devices on your network. Furthermore, you are likely interested in more than just "is the device up" monitoring. With that in mind, each monitored device can have multiple services monitored. But there is more to monitoring than just a screen showing the current state of everything. The various things you can do with this plugin are below:
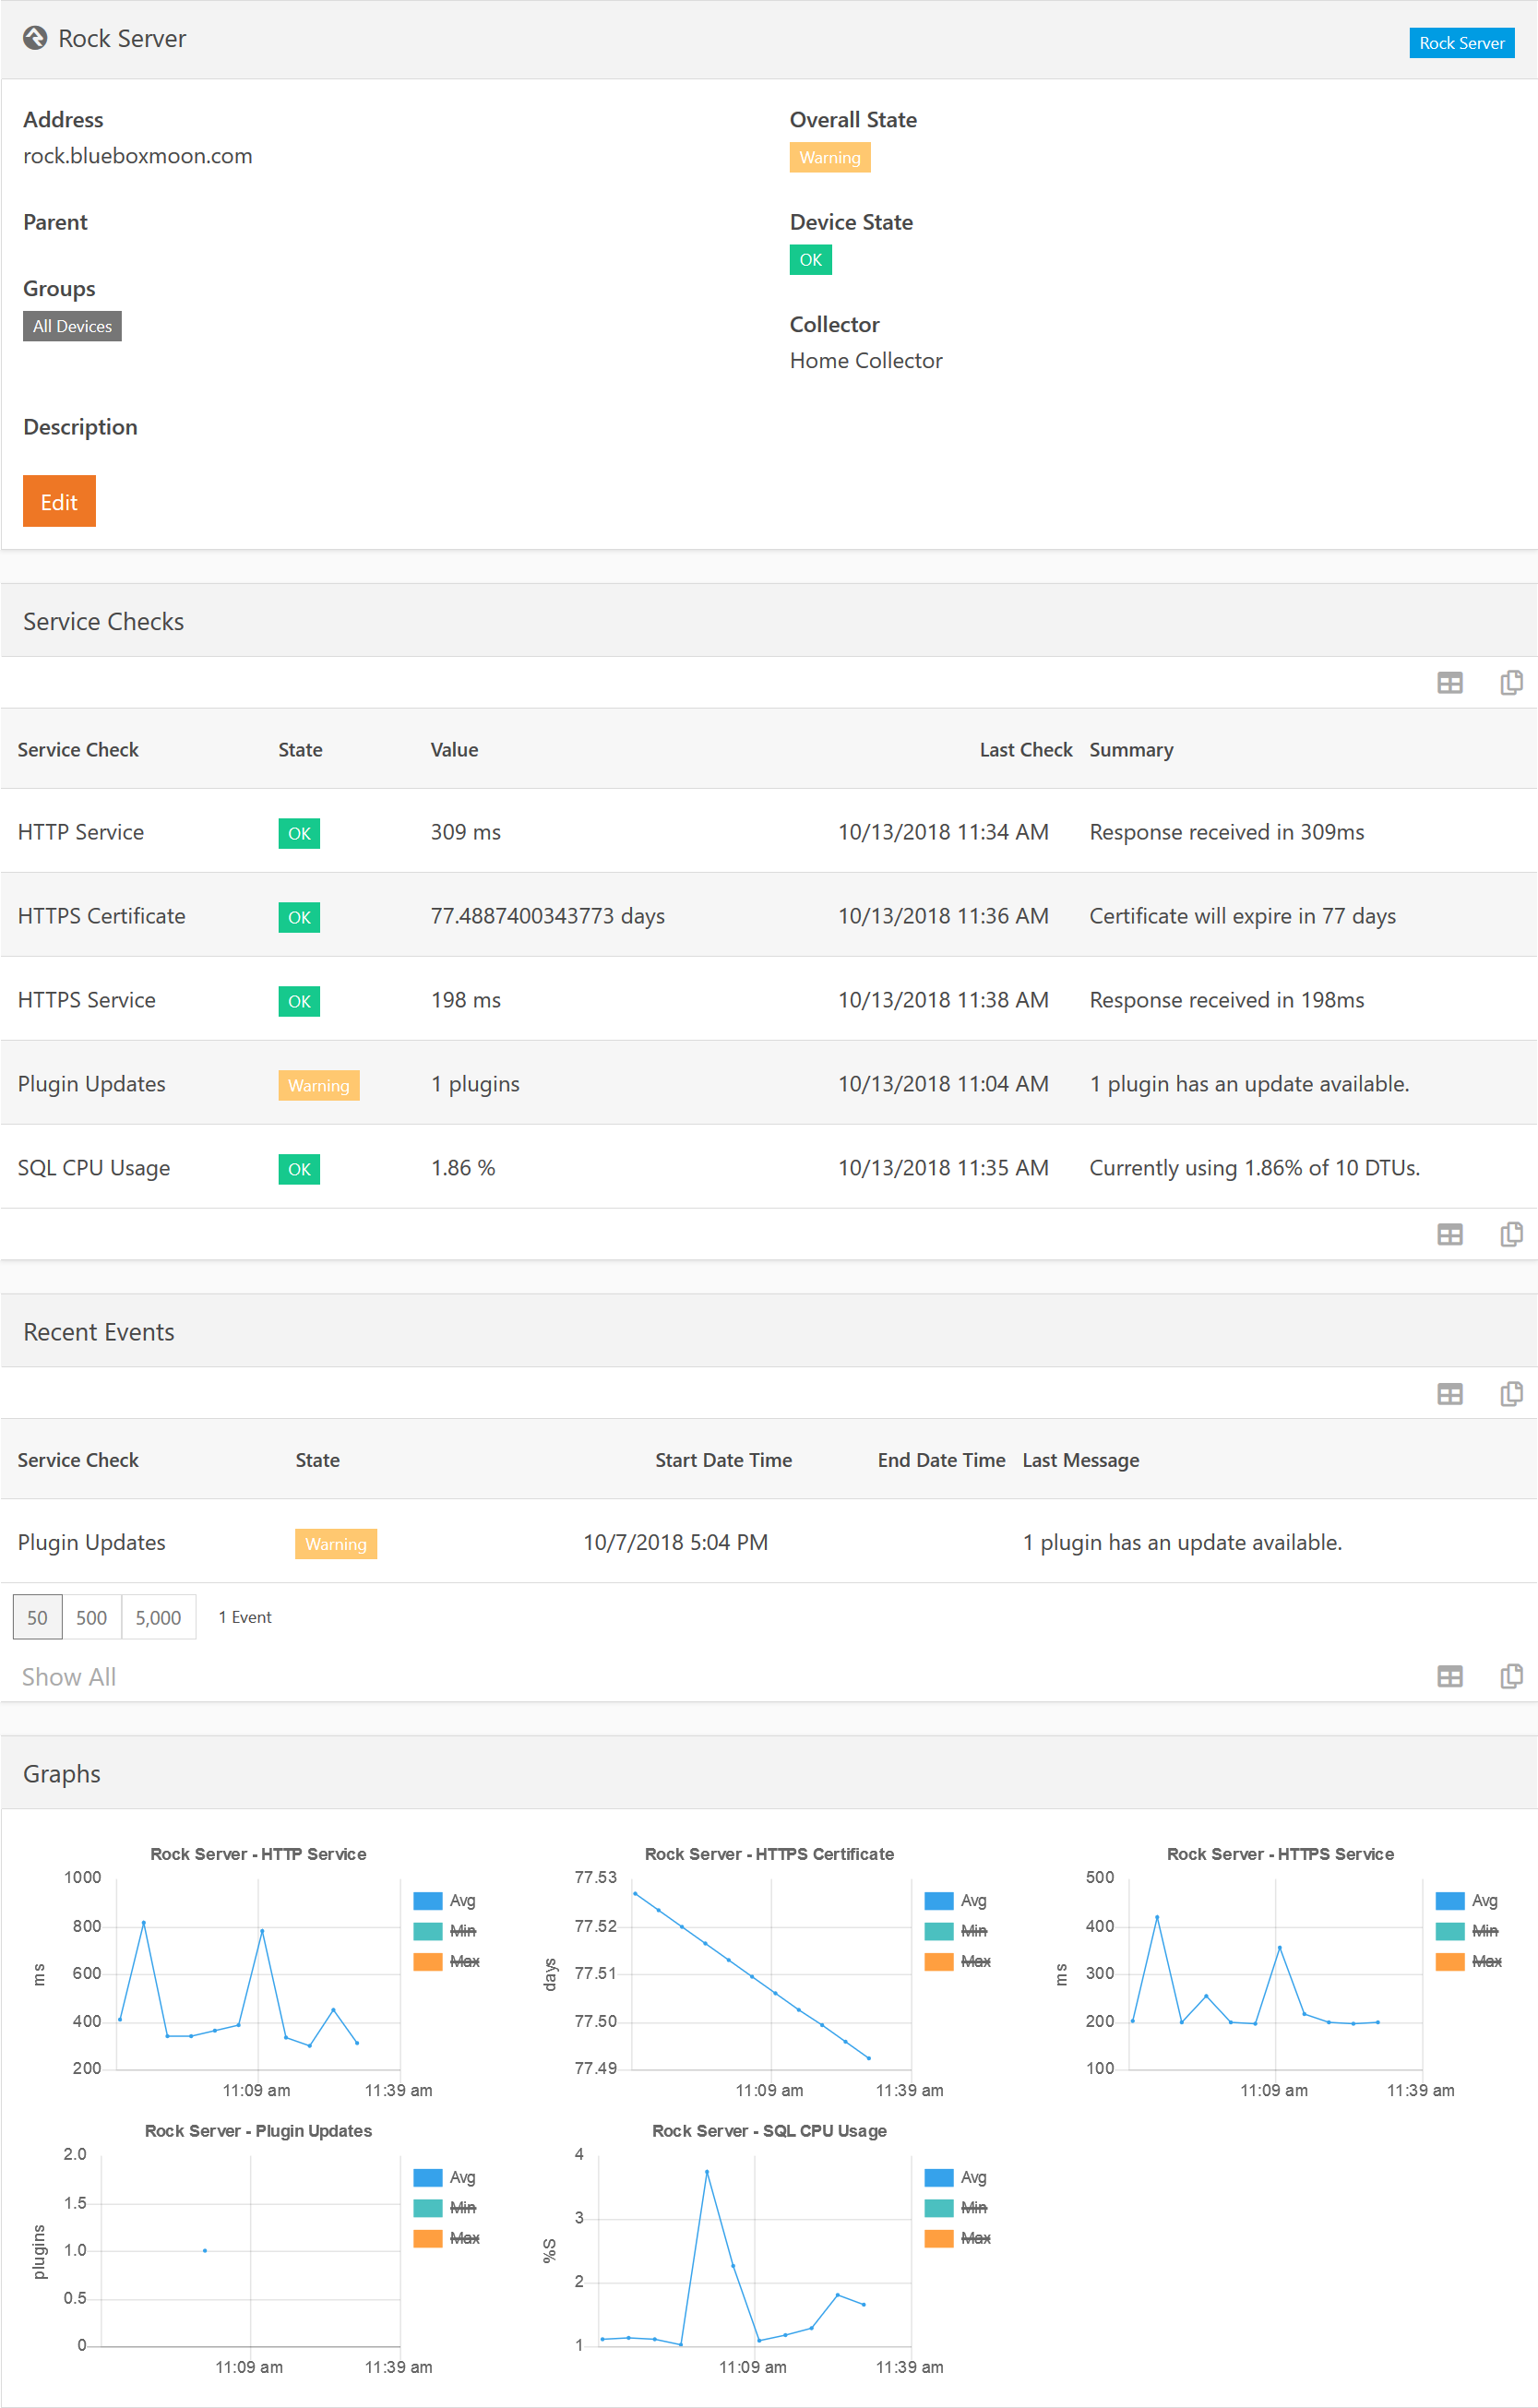
- Check the current state of a service.
- See historical charts of a service.
- See past events when a device or service was in a warning or error state.
- Receive notifications when a service is in a warning or error state.
- Schedule downtime windows where notifications are not sent (for example, maintenance windows).
- Build custom dashboards to quickly see the state of your devices.
The above list is not a fully inclusive list, but it does cover the larger pieces.
Quick Start
Before you jump in and try to start configuring things, be sure to read the section on the various Definitions used through these docs. In order to show you how to quickly get started with monitoring a device, let's get you going with monitoring the response time of your web server to make sure the homepage is loading.
First, we need to create a schedule. You probably want to monitor most things 24/7, so we'll create a schedule to do that. On the Watchdog Monitor page, select the Schedules page and add your first schedule. Name it 24/7. Next add a new schedule component by clicking the plus button again. For the Start Date / Time, use todays date and 12:00 am. Duration should be 24 hours, recurring every 1 days. This will make a schedule that is always active.
Next we need a device profile. So go back to the Watchdog Monitor page and then into the Device Profiles page. Create a new profile and call it Rock Server Profile. Set the Icon Class to fa fa-rockrms and select the 24/7 schedule we just created for the Check Schedule. Now add a Service Check and select the HTTP Service. Save the profile. Later, you can go back and add in the host check for Ping LAN, but since Windows by default doesn't respond to ICMP (ping), let's just leave that off for now.
Now we need to create the actual device to be monitored. Once again, go back to the Watchdog Monitor page and down into the Devices page and add a new device. Call this Rock Web Server. For address you can either enter the DNS name of your Rock server (e.g. rock.rocksolidchurchdemo.com) or just localhost for quick testing. Select the Profile we just created and select Rock Server as the collector. This will make Rock itself gather the information. Click Save.
Now, you can either wait about 60 seconds for the data collector job to run, or you can click the Play button for the HTTP Service in the Service Checks grid. You should, hopefully, see a green OK state appear. You now have Rock monitoring itself to make sure the website is loading quickly.
One last thing we need to configure for this to be useful, e-mail alerts. Back to the Watchdog Monitor page, go down into the Notification Groups page and add a new notification group. Call it Rock Server Alerts, select the 24/7 schedule and the Rock Web Server device. Then tick all three State checkboxes and save. Add yourself as a member to the notification group and enable either Email or SMS notification methods (or both if you want) and Save. Rock will now send you e-mail notifications if anything happens on the Rock server. If you want the SMS notifications to work as well, go to the Watchdog Monitor Settings page and select an SMS Number to use for sending those notifications.
I know we all hate reading documentation, but I highly recommend reading over this entire document one time to familiarize yourself with the different features and service check types. Your next steps will probably be installing a local Data Collector service if you are cloud hosted and setting up a few Device Profiles to use when monitoring all your devices.
Definitions
Below we will quickly cover the definitions used throughout this manual so that you have a better understanding of what we are talking about in the later configuration sections.
Devices
A device is a physical thing to be monitored. By itself, having a device exist in the system does not automatically collect data about it - that is where service checks come in. However, a device contains information about the device, such as IP address, so that the various service checks know how to gather the data they need. While we refer to a device as a physical thing, it does not need to be actual physical hardware. A device could also be a virtualized server for example.
Service Check Components
A component is basically the logic that drives a service check. For example, running an ICMP Ping against an IP address is a component. It contains the logic required to perform that check.
Service Check Types
A service check type defines how that component performs it's check and what options are set. For example, an ICMP Ping is useless unless we know what IP address to ping, or what return time is considered an error. The configured Types define this parameters. Out of the box you will find three different ICMP Ping service check types: Ping LAN, Ping VPN, and Ping WAN. Each one has different options configured because, for example, a device on the LAN is expected to respond faster than one over a VPN.
Service Checks
A service check is a single instance in the database that ties a service check type to a device. So the Ping LAN attached to the Rock Server device would be the instance of the service check. It records the results from performing ICMP Pings against the Rock Server.
Device Profiles
Trying to configure every single device individually would be a pain. In addition it would be prone to errors. If you intended to configure eight devices the same way you are more likely to accidentally forget something if you have to configure each one by itself. Profiles allow you to configure a "template" that all assigned devices will follow. As an example, you might create a HP Network Switch profile that is setup to monitor all these service check types:
- Ping LAN
- CPU Usage
- CPU Temperature
- Chasis Temperature
- Power Supply Status
You would then assign all of your five HP switches to this profile. If you update the profile, all the devices pick up the new (or removed) service checks as well.
Device Groups
While on the surface these may sound like the same thing as the Device Profiles they serve very different purposes. A Device Group is simply what its name implies: A collection of devices. A group can contain devices of different profiles and a device can be a part of multiple groups. For example, you may have device Check-in Printer 01 in the following device groups: All Devices, Check-in Devices, and Printers.
Events
An event is when a specific service check (e.g. "Ping LAN on Rock Server") encounters a warning or error condition. An event stores the starting date time of the event and the ending date time of the event. This allows you to go back and review historical events and see how long they lasted.
Schedules
In regards to the Watchdog Monitor plugin, schedules are slighly different than Rock schedules. They use much of the same back-end data, but provide some additional funtionality required for this plugin to work. Think of them as "advanced schedules". You might setup a schedule that covers the following three weekly times:
- Saturday 4pm - 7pm
- Sunday 7am - 1pm
- Wednesday 5pm - 8pm
This schedule might reflect your checkin schedule which covers multiple days of the week and different times on each day.
Notification Groups
Notification Groups allow you to define what you get notified about, who gets those notifications, when they will be notified, and how they get notified. Let's break that down a bit more. In the following paragraphs, let's assume we are talking about a notification group called Checkin Notifications for things related to weekend checkin.
You specify what you get notified about by adding individual devices or device groups to a notification group. For example, you might add the device groups Checkin iPads and Checkin Printers in addition to the single device Rock Server as they are all related to checkin working properly.
Each notification group specifies who gets notified by adding People to the group. So you might have your IT person in charge of configuring checkin, your weekend IT person and maybe the Children's Pastor all in the group. They all would like to know when checkin had issues.
Next we need to specify when they get notified. Each notification group is assigned an (advanced) schedule to associate it with. If an event on a device happens and there is no notification group it is a member of with an active schedule, then no notification is sent.
Finally, we need to know how to notify those individuals. Each person in a notification group has a Notification Method setting that specifies if they want an E-mail and/or an SMS sent to them. In this example, the on-duty IT person might want an SMS so they can go check it right away. The Children's Pastor and IT person in charge of configuration might just want an e-mail so they know about it.
Downtimes
Another piece of the puzzle are downtimes. These let you schedule times when notifications should not be sent - overriding the notification group schedules. For example, you might have two iPads sent out for repair and they won't be back for three weeks. You don't want to remove them from the notification groups as that would mean you need to remember to put them back in. Instead, you can create a downtime for those two iPads with the appropriate date range so that they will be considered "known offline" for that date period and no notifications will be sent.
Data Collectors
A collector is a process that runs the service checks. Out of the box your Rock server will act as a data collector. But that may not be good enough. Your Rock server may be behind a strict firewall that prevents it from talking to the internal LAN. Or you may be cloud hosted in which case your Rock server is for sure not able to talk to your LAN. You can install one or more remote data collectors. These are Windows Services that run in the background and talk to your Rock server to determine what service checks need to be run, running them and then uploading the results to your Rock server.