Service Check Types
Out of the box, we provide a number of standard service check types already configured. This should get you started pretty quickly, but you will probably want to customize these and/or create your own service check types to handle specific scenarios.
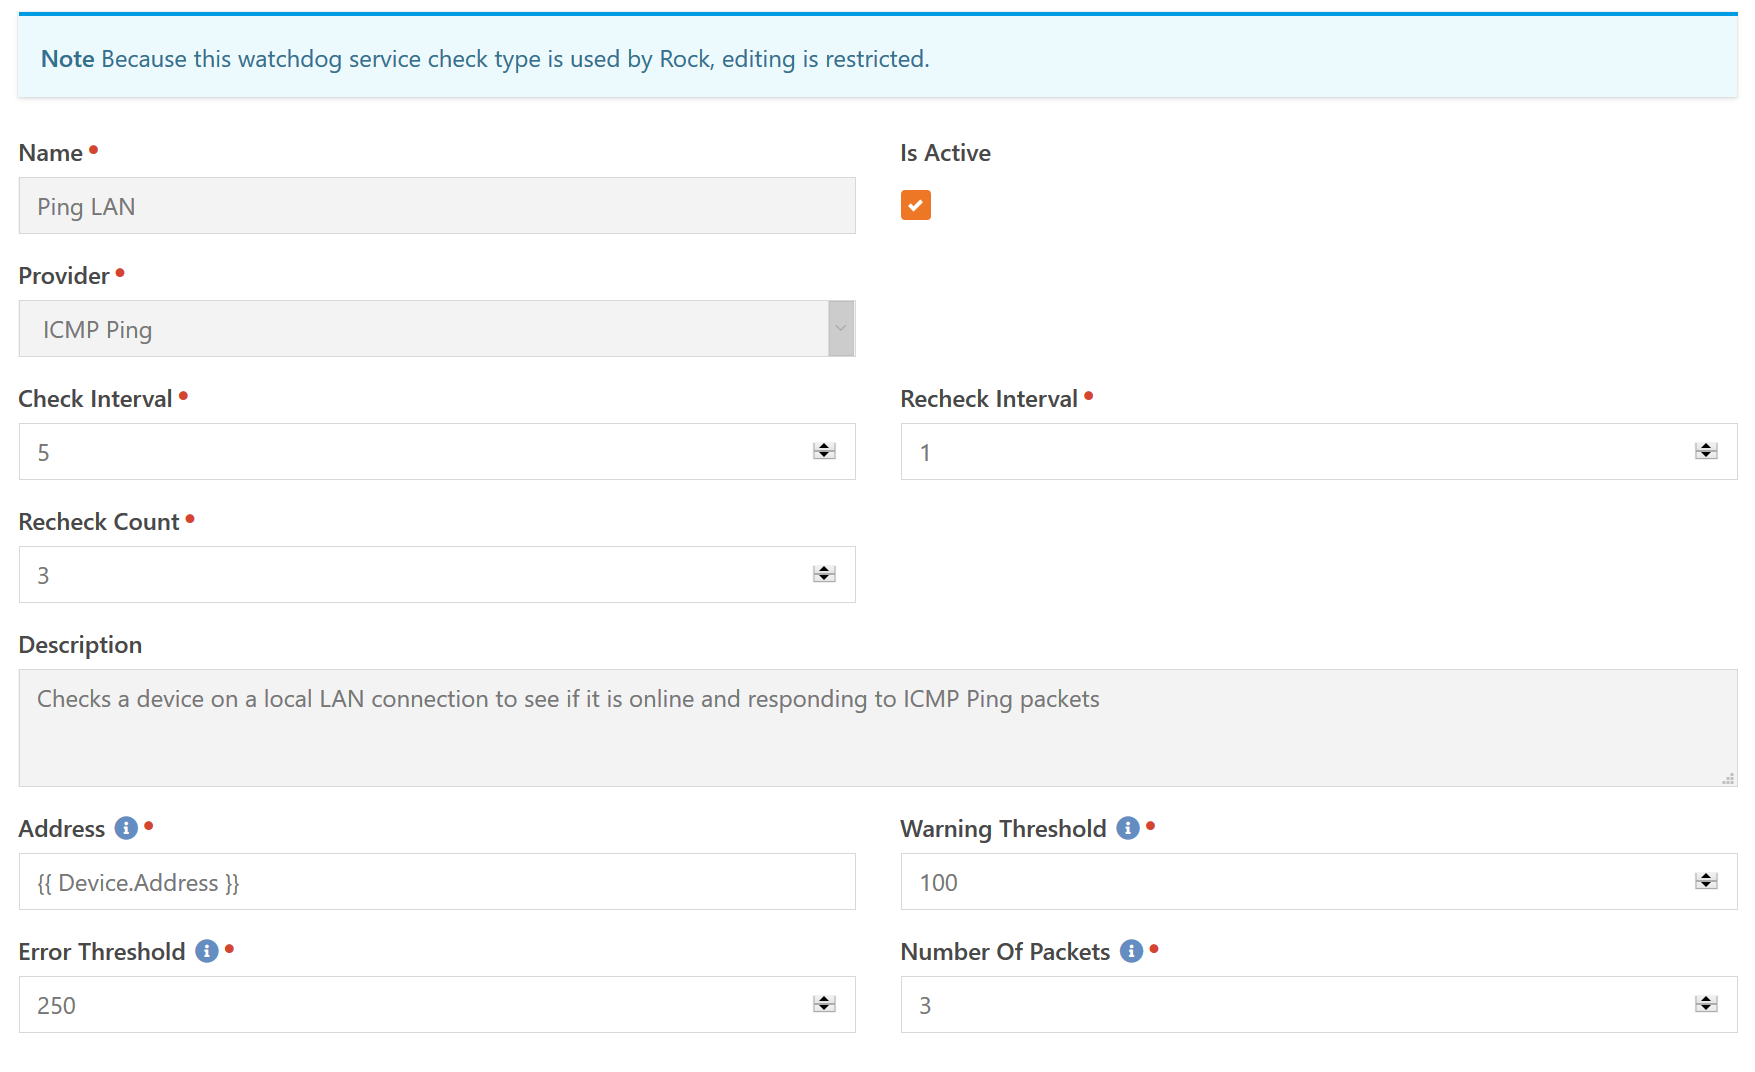
The first item to be configured with a service check type is the Provider (Component). This specifies the fundamental type of check to be performed. In this case, we are going to be configuring an ICMP Ping.
The timing of the checks is defined by the three settings: Check Interval, Recheck Interval and Recheck Count. When a service check is in a given state, the Check Interval is used to determine the number of minutes between checks. In this case, every five minutes the device will be pinged.
Before we talk about Recheck Count and Recheck Interval we need to discuss the concept of a "soft state". When a device is functioning normally, it's in the OK state. This is considered a "hard state", it's known to be true. If a single ping check comes back at 400ms that would be considered an Error state. However, this will not trigger an immediate notification. The reason is that this is considered a "soft state". We think the state might now be Error, but it could also just be a transient result. A blip in the network if you will. So a state change will go through a period of "soft state" before becoming a "hard state".
This is where the Recheck Count comes in. When a state changes (whether from OK to Error, vice-versa, or any other combination of state changes), it goes through this "soft state" for the number of checks specified in the Recheck Count. In this case, we run three additional checks before making the new state a "hard state". But, you three extra checks at five minutes each means you have to wait fifteen minutes before getting a notification. When performing these "rechecks", the Recheck Interval is used. In the above example, with a recheck of one minute, that means it will only wait an additional three minutes total (three checks at one minute intervals) before you get notified.
The final section is all the configuration options of the specific Provider. Each provider has it's own options and you will need to see the in-line help for specific information. One thing to note, is that nearly every text-type field supports Lava as you can see in the example above for the Address field.
Device Profiles
Device profiles, as mentioned previously, allow you to setup a configuration that multiple devices use. Below we will show a sample of how you might configure monitoring your PFSense firewall devices.
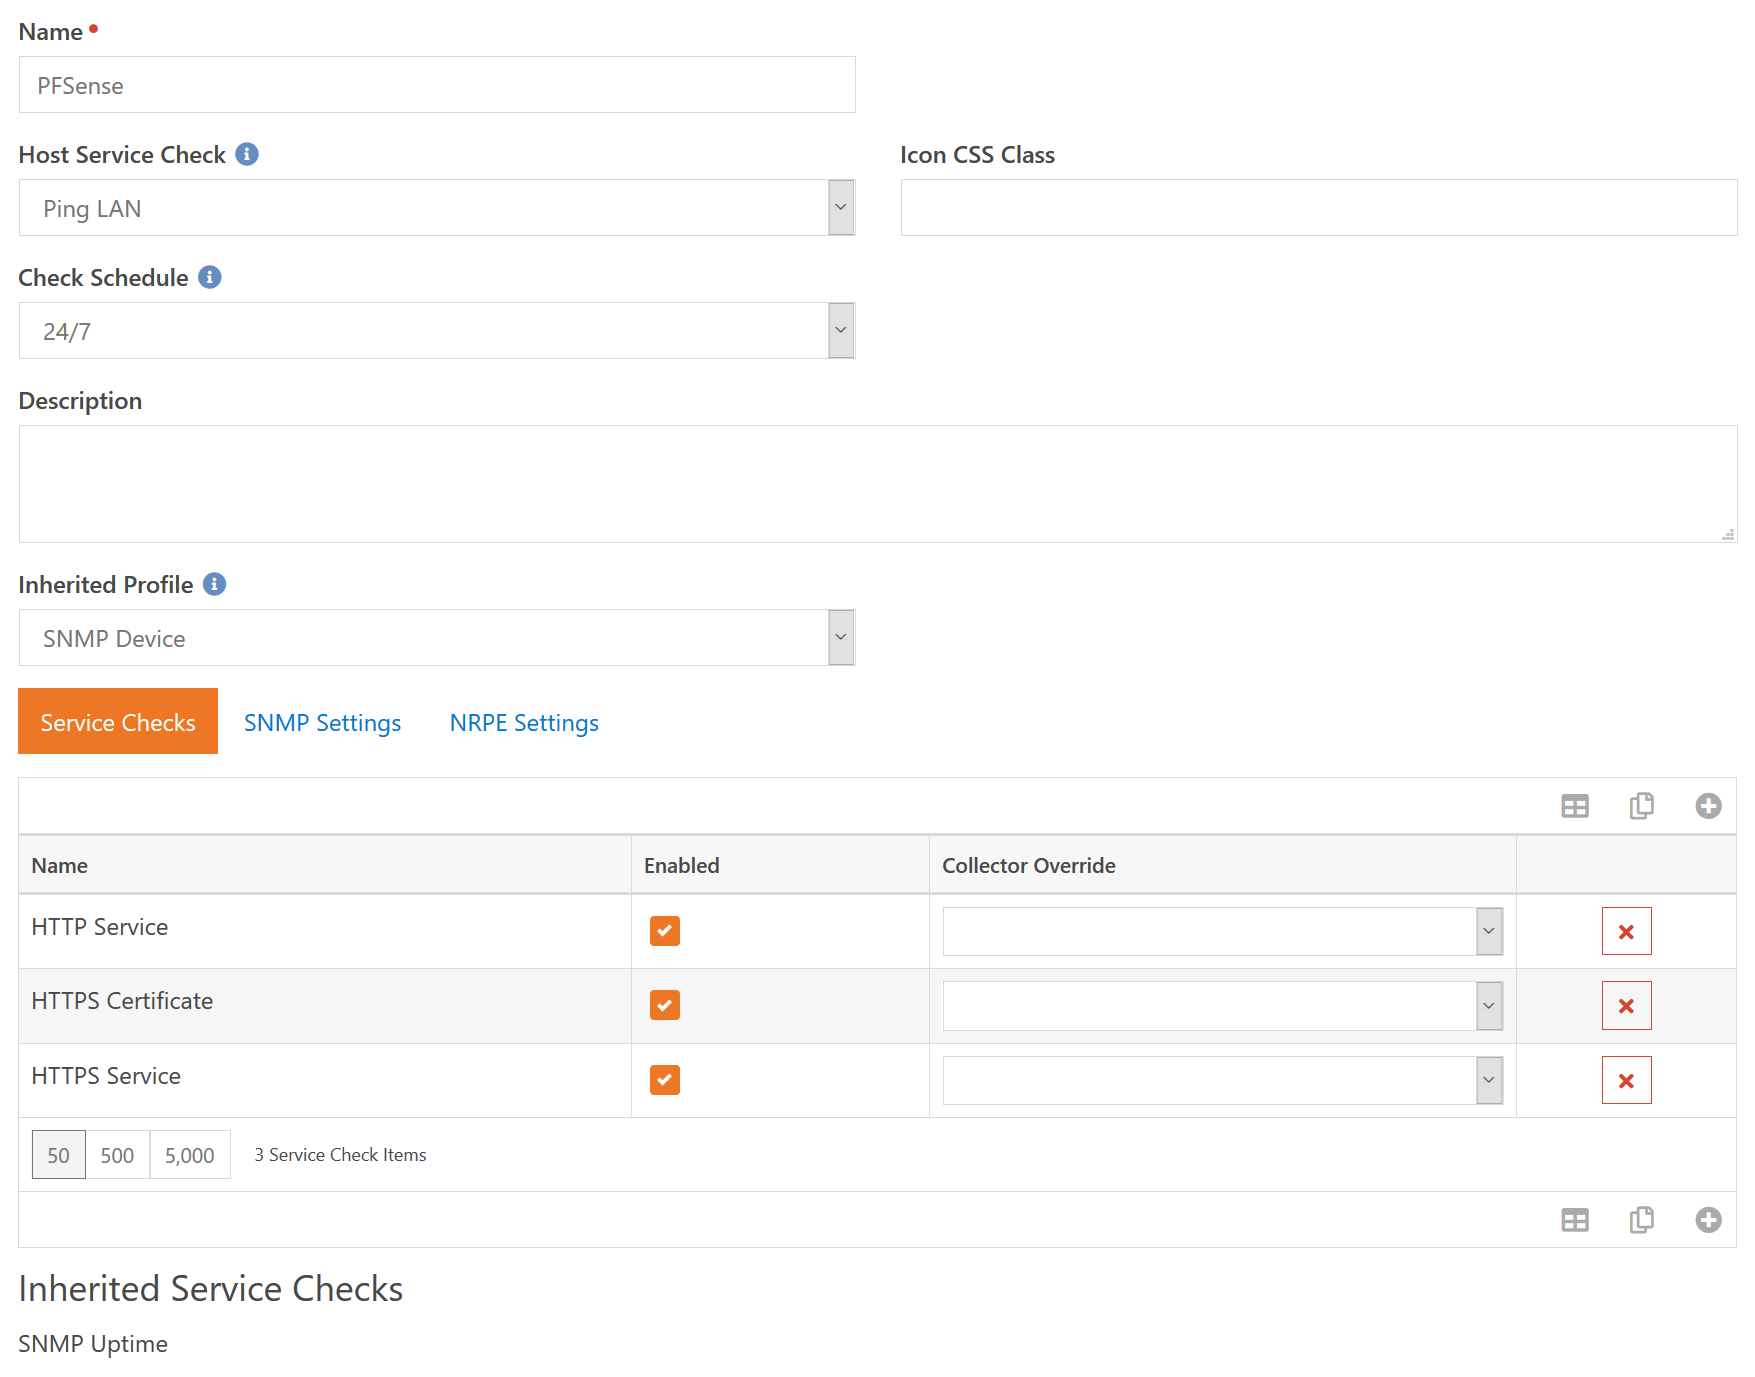
So the name is rather self explanetory. This is what the device profile is called and what shows up when you need to select a profile. The Icon CSS Class is used to provide the icon for any device that uses this profile.
We're going to make another segue and talk about the difference between a "device state" and the "device overall state". The former is tied to the Host Service Check in the image above. The Host Service Check is used to determine if the device itself is up or down. Or, said another way, it's used to determine the "device state". When the "device state" reports that the device is in the Error state, none of the other service checks for that device are run. In this example, if we cannot successfully ping the device, then we almost certainly won't be able to run the three web related checks. One primary reason this is done is that in the case of a ping failure you would (hopefully) only receive a single error notification rather than foure total.
So back to the sample screenshot, the Host Service Check is again what is used to determine if the device itself is up or down. The Check Schedule will be used to determine in what time period the service checks for the device will be executed. In this case, we are going to run checks seven days a week, twenty-four hours a day.
One device profile can inherit specific settings from another profile. These are which Service Checks are performed on the device as well as the SNMP settings, which specify how to authenticate for SNMP related checks. The bottom of the screenshot shows that any service checks that are inherited from the parent profile(s). This inheritence is also why the Enabled check box is there. If a parent profile includes a service check that you don't want these devices to use, you can add the service check again and turn off the Enabled checkbox.
In this example, we are inheriting from SNMP Device which gives us the SNMP Uptime check. On top of that, we are going to add service checks to make sure that HTTP and HTTPS are working properly, as well as a check to make sure the SSL certificate is valid and not expiring in the near future. One final thing to note is the Collector Override setting. In a moment when we look at creating a Device, we will talk about the Collector the device uses. The Host Service Check will always use the configured Device Collector. But the other individual checks can override that and use a specific collector.
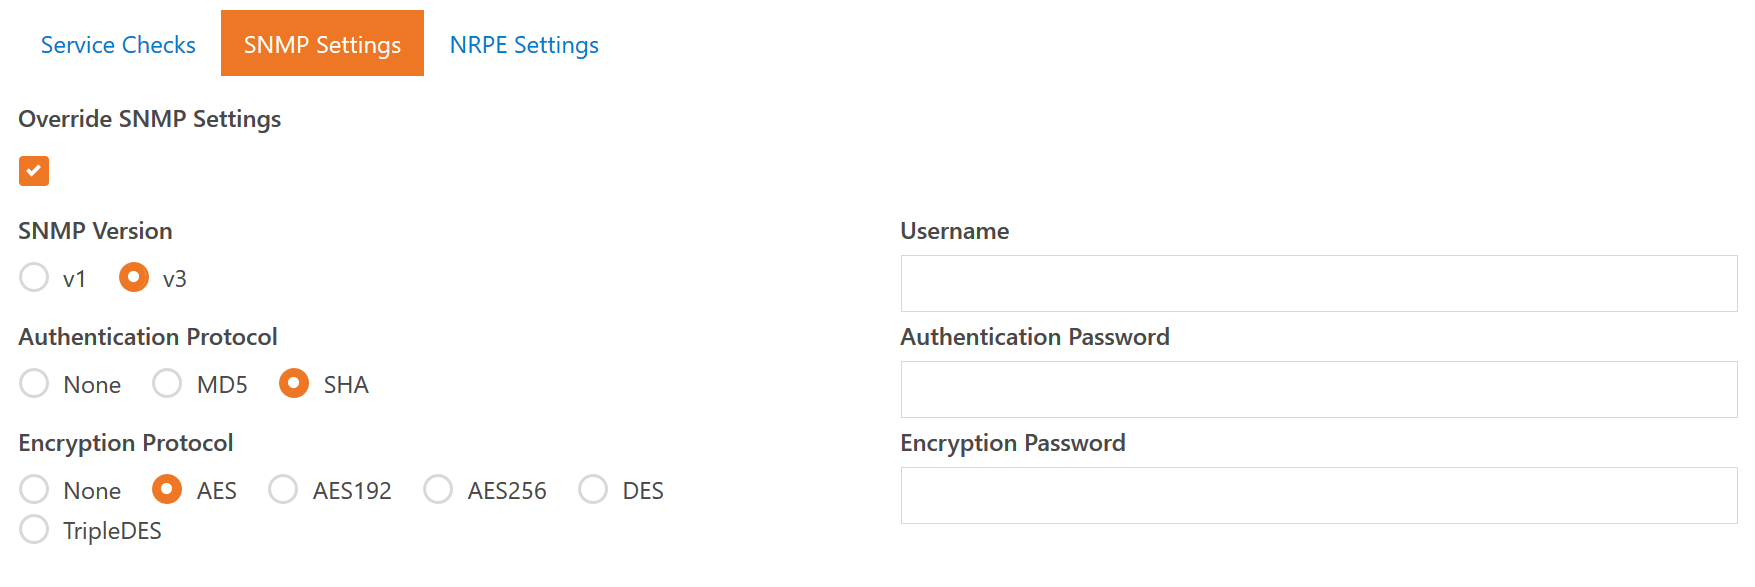
As you can see, the SNMP settings are very flexible and allow for just about any combination of settings that your devices may require. Some devices let you choose authentication and encryption options, others just mandate what you must support. So we decided to give you the whole kitchen sink. One thing to note, If you choose SNMP v1 it is actually running v2, but in our testing there has been little difference except that some devices claim to use v1 when they are actually using v2 - which causes some data to not return correctly unless we are also using v2.
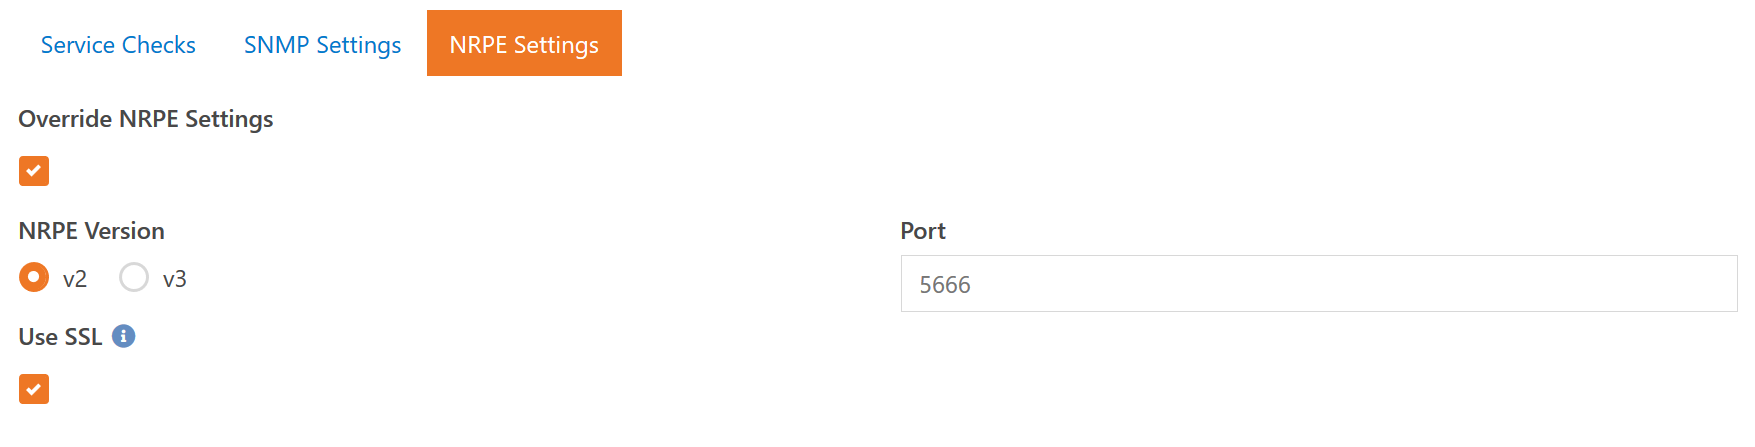
We'll talk more about NRPE checks later, but these are Nagios Passive checks. Meaning the data collector (Rock or other collector you install) will query the device via NRPE for its state. If you already have some servers using Nagios-style checks then you can configure some custom service check types to take advantage of those. One thing to note is that our NRPE checks do not support so-called "insecure encryption" that older Nagios systems use. This is a limitation of the libraries available to us and requires you to use either no encryption or full SSL certificate based encryption.
Devices
Okay, now we start getting into the fun stuff. Actually adding a device so we can run checks against it.
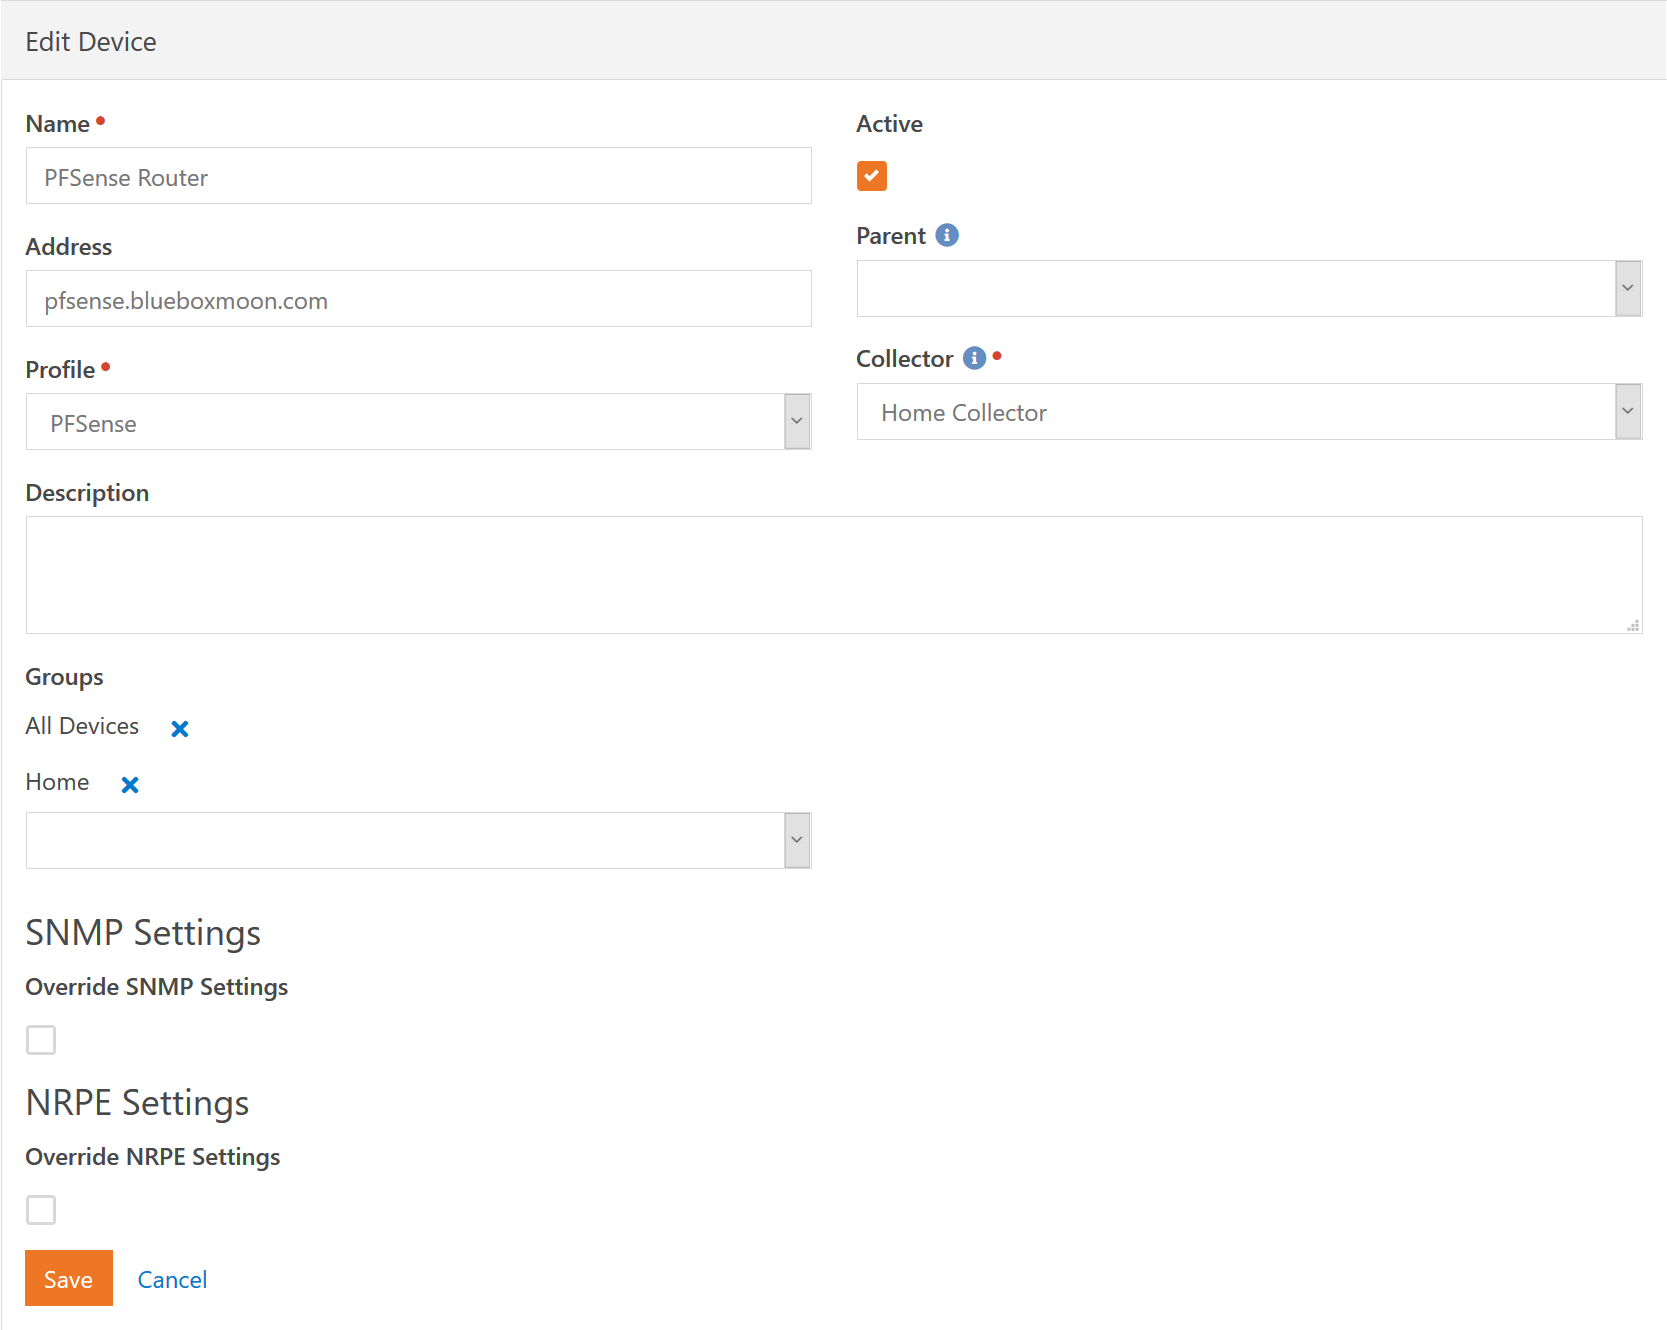
Most of these fields should be self explanetory. We'll only cover them briefly. The Name of the device is a user friendly name so you don't need to enter any DNS names here or anything like that. If you turn the Active checkbox off then all service checks will be disabled. Normally you will want to use a Downtime instead, but this could be useful if something is acting up at the end of the day as you are about to leave and you just want to turn off monitoring for the night before you go home.
The Address of the device is optional. If provided it can be either a DNS name or IP address. The Profile and Collector specify the obvious. The Parent is a way to build in automatic silencing of devices and service checks. For example, if the network switch for the Children's Building goes down, you don't want to get notifications about all the devices in the building. You know they are down because the switch is down. So you can build a virtual device tree. If a parent device is in an Error state then you will not receive notifications about any "child" devices.
As we previously mentioned, each device can be a member of any number of groups. This allows you to collect like devices into a single group and monitor their status on the Dashboards collectively. As an example, you might have a group for Network Switches and put all your switches in that group. This way on your dashboard you can have a single monitored item called "Network Switches" and know at a glance that all your switches are good.
Finally, each device allows you to override the SNMP Settings and NRPE Settings inherited from the Profile. If all your PFSense Routers use the same SNMP settings except one, you don't need to create a whole new profile just to specify those settings.
Schedules
Schedules are fairly straight forward, though it may take you a few minutes to think through how these advanced schedules are constructed. These advanced schedules are simply a collection of the schedules you are already familiar with. To simplify configuration, a single schedule component cannot go past midnight.
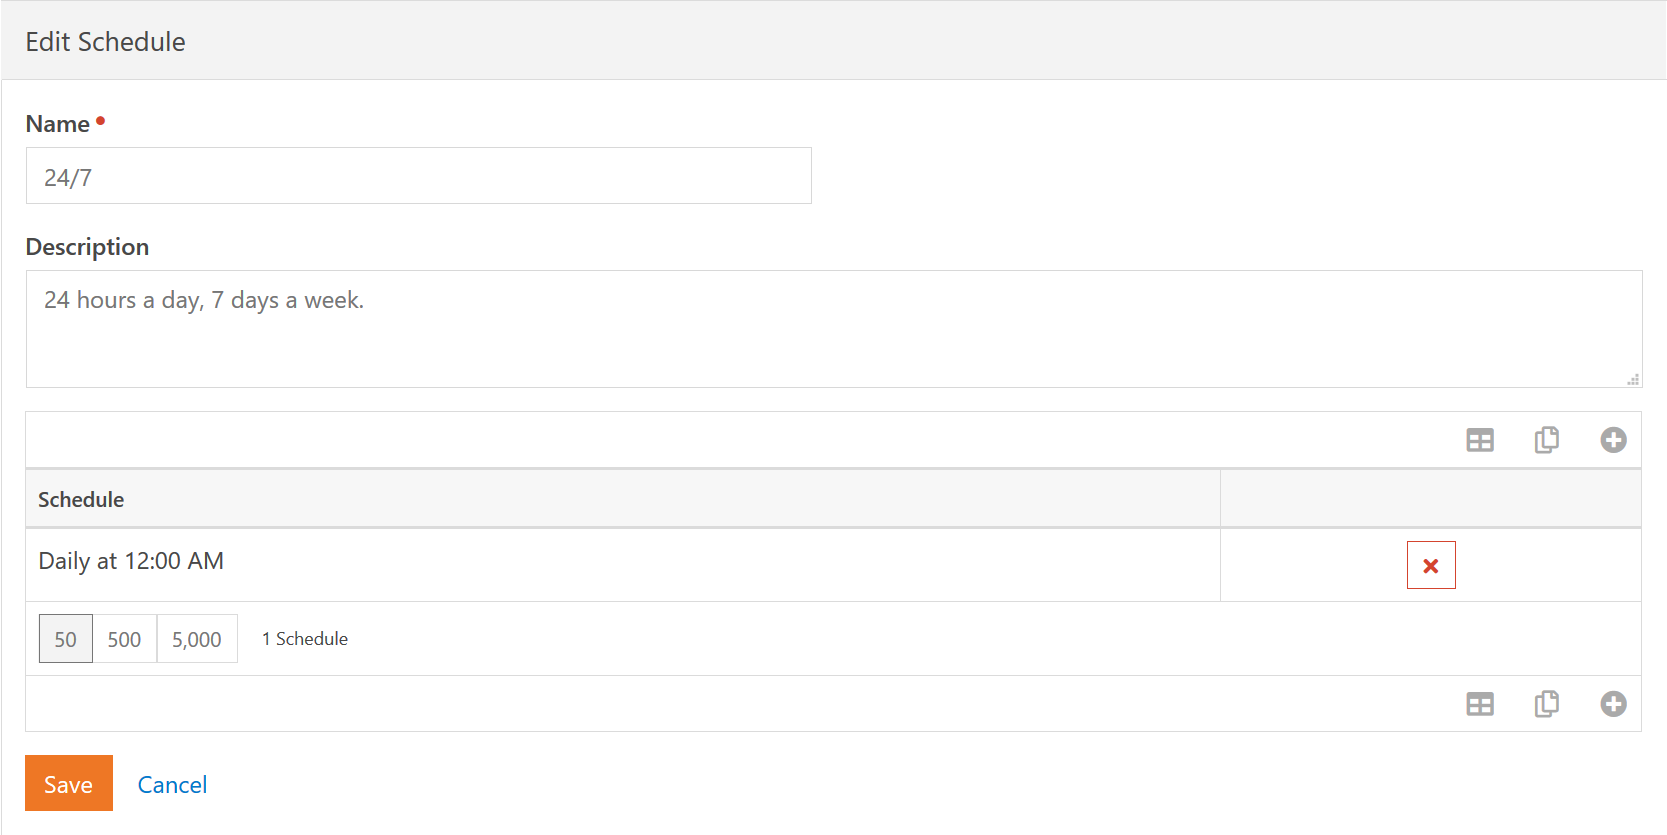
In our example, we have a single component that is Daily at 12:00 AM and runs for 24 hours. This gives us a standard 24/7 type schedule. A more advanced setup might be for a "checkin schedule" that covers all the various times check-in devices are active and setup to be monitored. Such a schedule might contain the following component schedules:
- Saturday at 4:30 PM and runs for 4 hours.
- Sunday at 7:00 AM and runs for 5.5 hours.
- Wednesday at 6:00 PM and runs for 2 hours.
Notification Groups
The notification group lets you create a very customized way to send notifications.
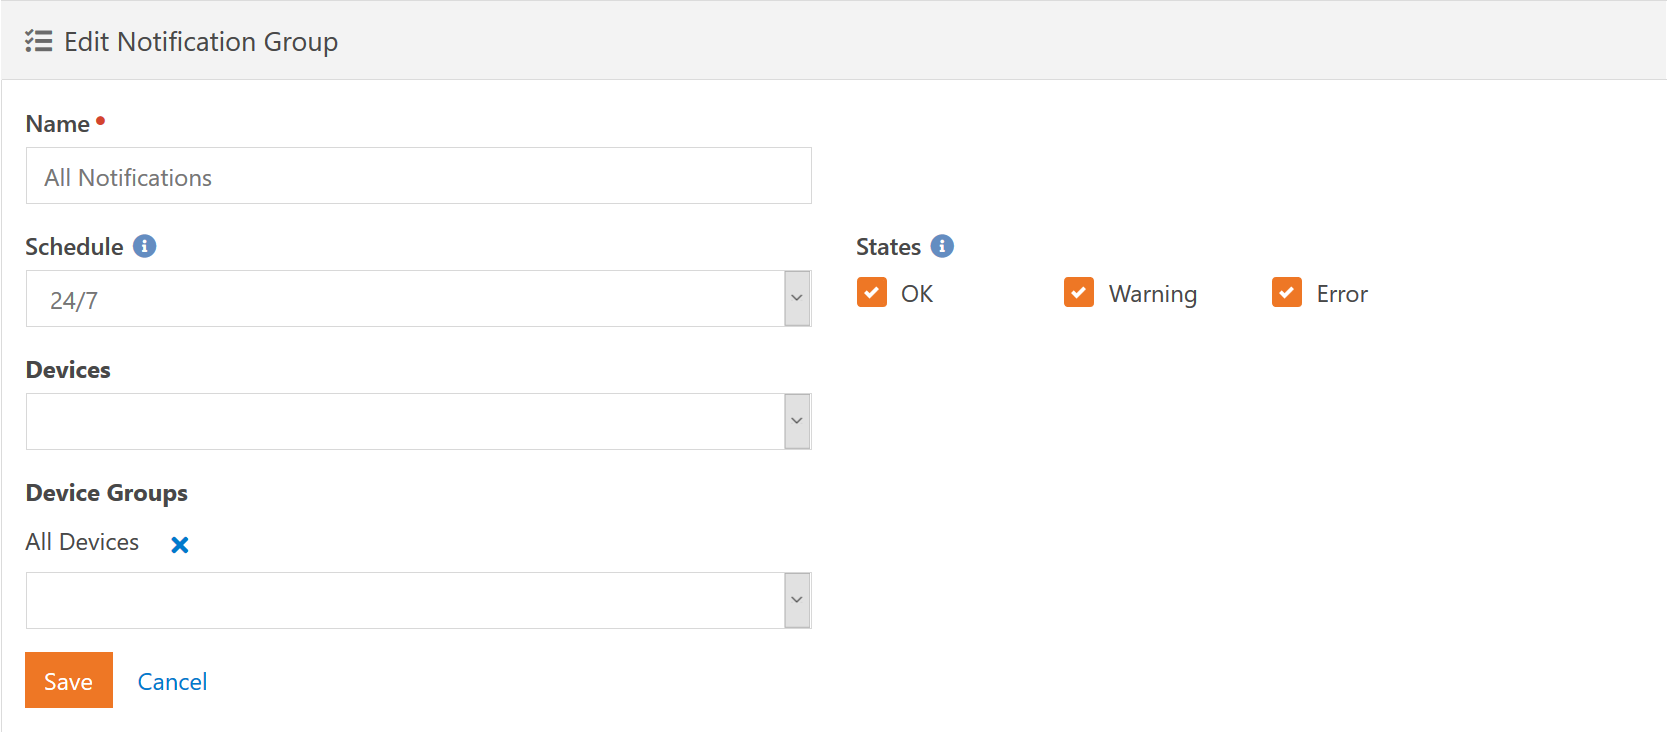
The Schedule specifies what schedule that notifications for this group will be sent. This schedule includes both the immediate notifications as well as the hourly notifications. Immediate notifications are those that happen and tell you about a single service that has changed state. The hourly notifications are aggregate and tell you all the service checks that are currently in a non-OK state.
You can dictate which states you want to be notified about by selecting them in the State checkboxes. For immediate notifications, these are the states that a service check must change to in order for the notification to be sent. For the hourly aggregate notifications, these are the states that the service check must be in for the notification to be sent. The exception to this, as we just mentioned, is that the OK state is always ignored for aggregate notifications. You don't really want an e-mail every hour telling you how many services are OK do you?
Each notification group can be tied to either Device Groups or individual Devices. A device can be referenced multiple times via individual reference and group reference. It will not cause any issues and you will not receive multiple notifications for it.
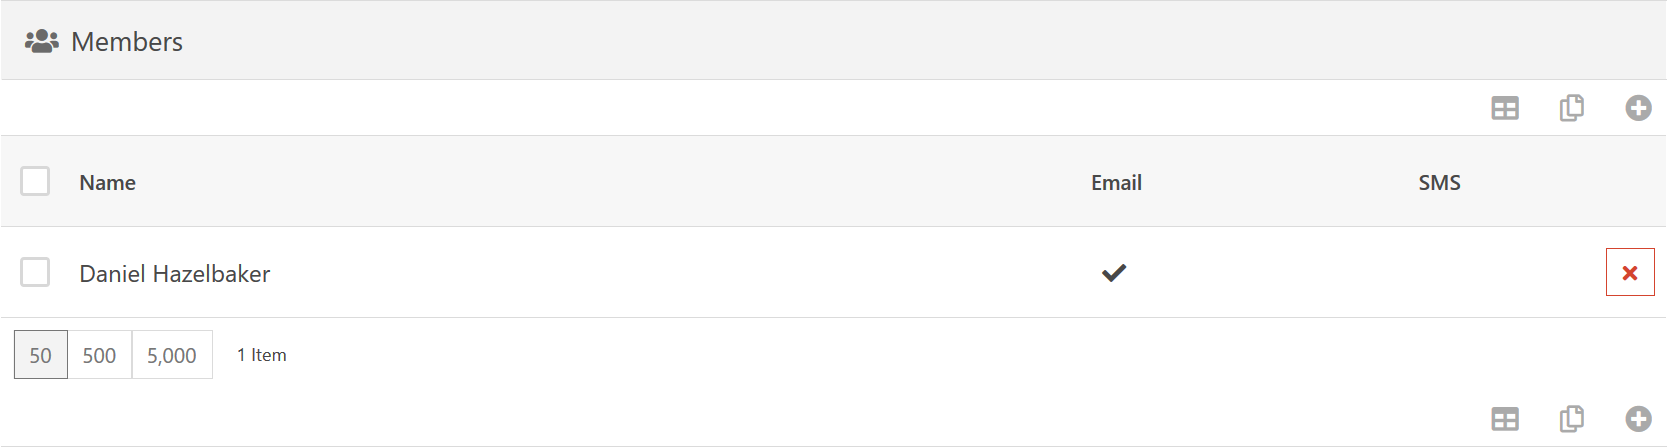
So we have configured what devices we are going to send notifications about, but we need to also specify who will receive those notifications. You can add people to the Members list and specify whether they receive Email notifications or SMS notifications (or both).
One final thing to note, is that when notifications are sent, the system builds an aggregate list of all notification groups and the people in them. Meaning, if a device is matched in three different notification groups and you are listed in two of the groups as Email notification and one group as both Email and SMS, then you will only receive one notification of each type. Meaning, one Email and one SMS.
Data Collectors
Out of the box, your Rock server is configured to be a data collector. There is a Job that is configured to run every minute and process any service checks that need to be run - and are configured to use the Rock server as the data collector.
However, this may not work in your environment as your Rock server may not have access to your internal network. In this case, you can go to the Power Tools > External Applications and download the stand-alone installer. This will install a Windows Service that can run and perform service checks on that Windows server. It is worth noting that you can do this on as many Windows servers as you want. So if you want to put a data collector at each site, feel free. Another thing to keep in mind is security. Because you are sending potentially sensitive data (such as SNMP authentication settings) over the network, it is important to use an SSL connection from the collector to your server.
Once you have installed the remote Data Collector you need to configure it to talk to your server. Currently, this is done by going to your Defined Types page and look for the Watchdog Monitor Collectors type. Open that up and add a new Value. The Value is just a user-friendly name that you will see when selecting Collectors. The Authentication Key can be anything, but we recommend a long sequence of random characters. This is used to identify your remote collectors and is also used as the password for the collector. As such, each collector must have a unique Authentication Key.
On the Windows server, you should see a new application in your Start Menu called Watchdog Monitor Collector Service. Run this and configure the URL used to communicate with your server (for example, https://rock.rocksolidchurchdemo.com/) and the Authentication Key you created for the collector. You will also need to enter the Shared Secret that is defined on the Settings page (described below).
While the collector will allow you to use a non-SSL port, please do not do this in production use. The Rock server will need to send sensitive information (such as NRPE and SNMP credentials) to the data collectors in order for them to do the work they need. Therefore, you should only use an SSL connection in production.
Settings
System-wide settings can be changed on this page, such as the notification templates. Out of the box, most of these values will probably be fine for you - other than the SMS Number.
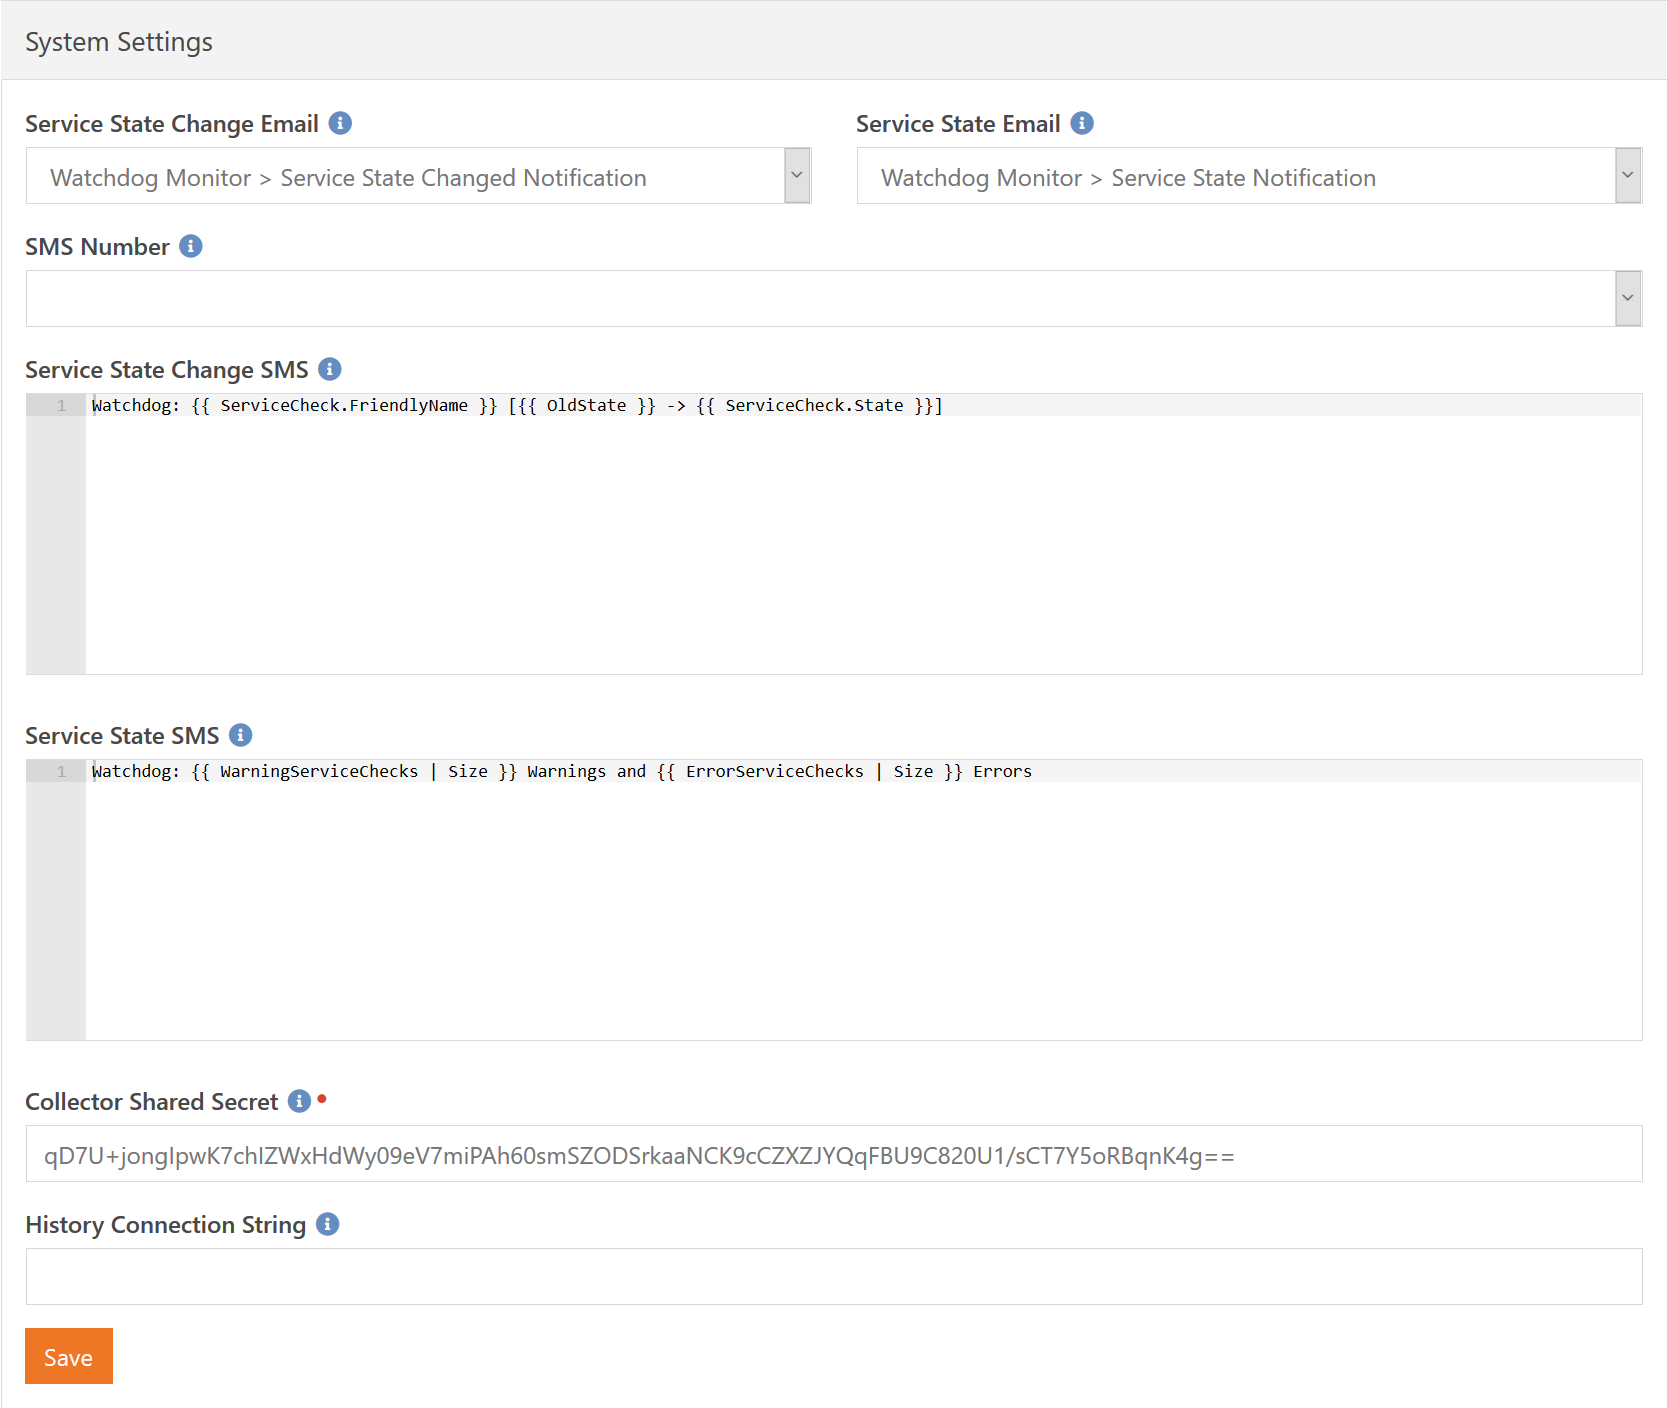
If you want to customize the e-mail templates used, then you can create your own and then update the active e-mail templates here. The Service State Change Email specifies the system e-mail that is sent when a single service check has changed state (e.g. from OK to Warning). The Service State Email specifies the e-mail to be sent on a periodic basis telling you what all services and devices have issues.
The same logic applies to the Service State Change SMS and Service State SMS message values. Additionally, if you plan to use SMS notifications then will also need to specify which SMS number to use when sending those notifications.
The Collector Shared Secret is used as an additional layer of security when authenticating remote collectors - after all, you will be sending sensitive information to the remote collectors so that they can contact the devices they are monitoring. A unique value is generated for you on install, but if you ever need to change the value you can do so here. Just remember you will need to also update any remote collectors to use this new shared secret value.
Finally, the History Connection String can be used to override where the plugin stores historical data. For a smaller install, this would not be needed. Larger installs may put so much data into your database that you would rather keep outside the Rock database. This value should be either blank to indicate the internal Rock database, or a standard SQL Server connection string to connect to a remote server.
Dashboards
You can create as many dashboards as you want, each showing the same or different devices. The dashboards are designed with Lava so you can style them anyway you want. Below we show two of the default dashboard styles you can use: A list, and buttons.
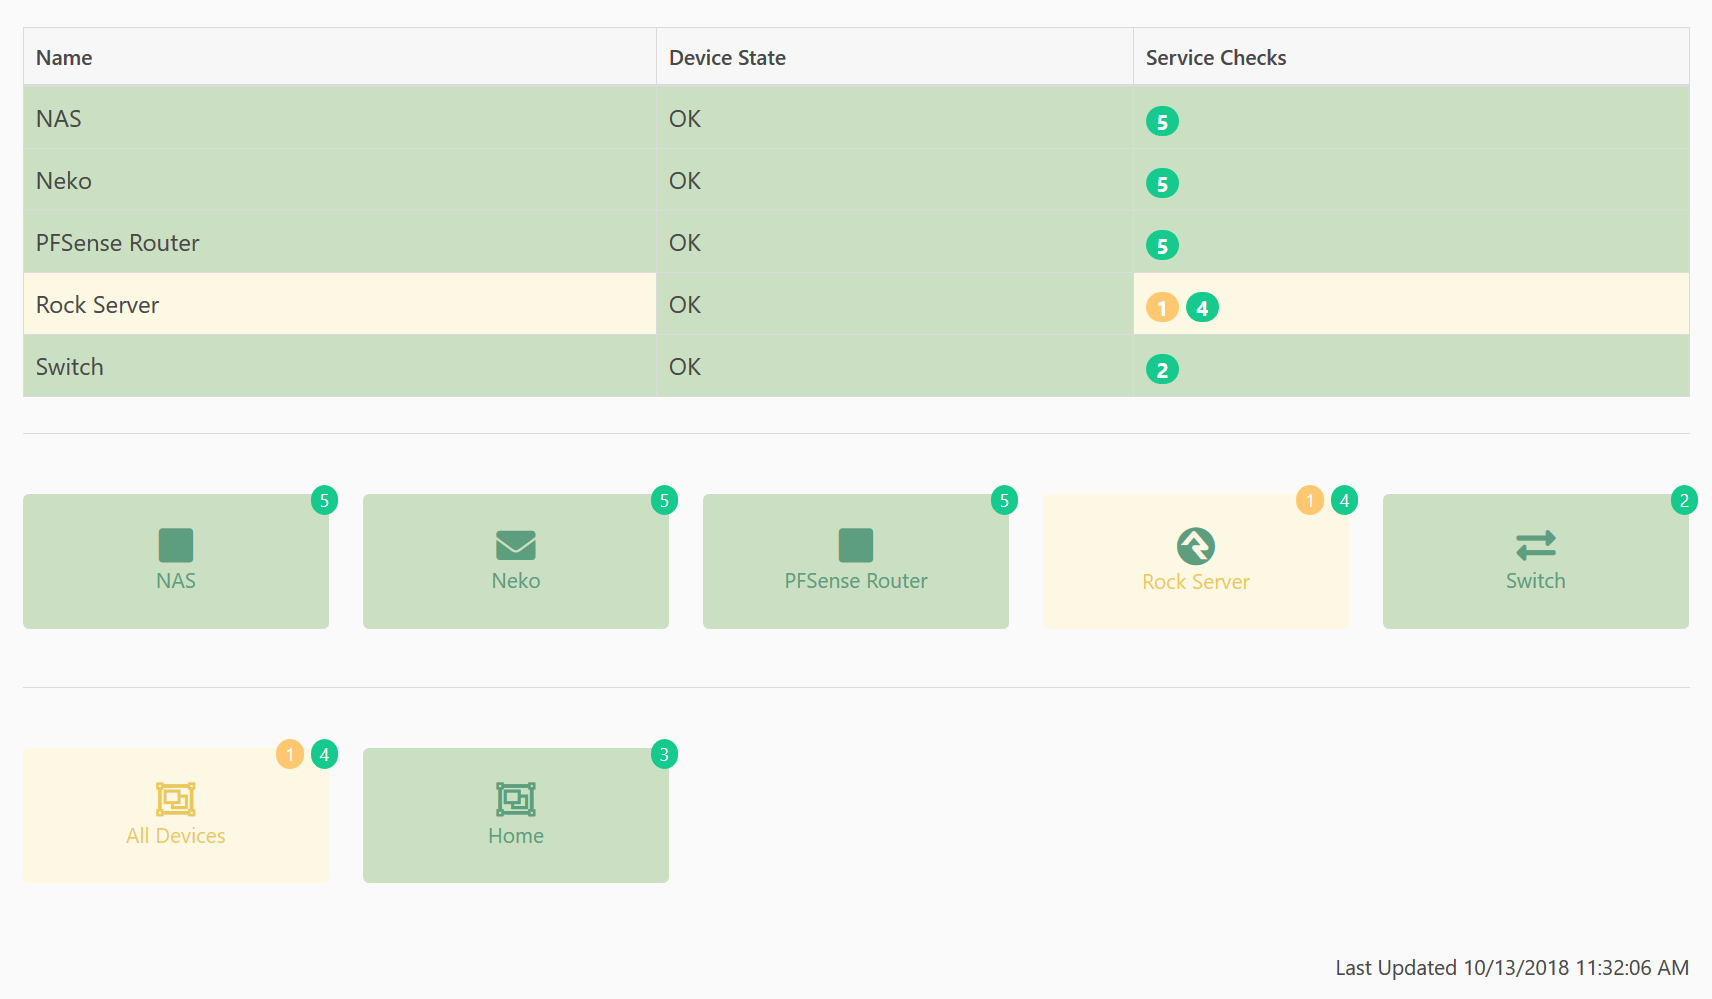
The top section shows individual devices as a table. The Rock Server has a yellow background for it's Name and Service Checks because one of the service checks is in a warning state. The Device State column is still green because the device itself is still OK, that is, it's responding to Pings correctly.
The second section also shows individual devices, but uses a layout similar to the internal Rock "page-menus" that show up as blocks. Again, the Rock Server shows a yellow background but the icon still shows up as green indicating that the overall state is warning, but the device state itself is still OK.
The final section also shows as a block, but these are showing the overall states of the two device groups we have defined. So we can see at a glance that something in our All Devices group is in a warning state. However, we can also see at a glance that everything at Home is working correctly.