Collector Status
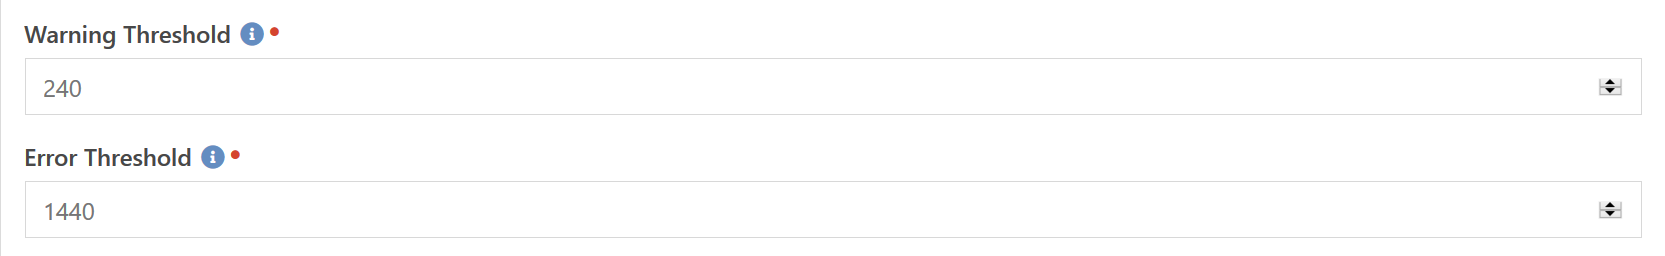
This is a fairly simple component to setup. When you have one or more remote collector services running, you you have created a single point of failure in that if the collector service stops running for some reason then you don't know that a device might have entered an error state. Thus, you need a way to monitor the collector services as well. This service check does just that. When setup to run on your Rock Server collector, it will check any configured remote collectors to see when they were last active.
If any collector has not contacted the Rock server within the specified threshold limits, then this check will enter the warning or error state and alert you.
[!IMPORTANT]
This component must be run on the Rock server itself, which means you may need to specify the Rock server in the Collector Override when you attach it to a device profile.
DNS Blacklist Lookup
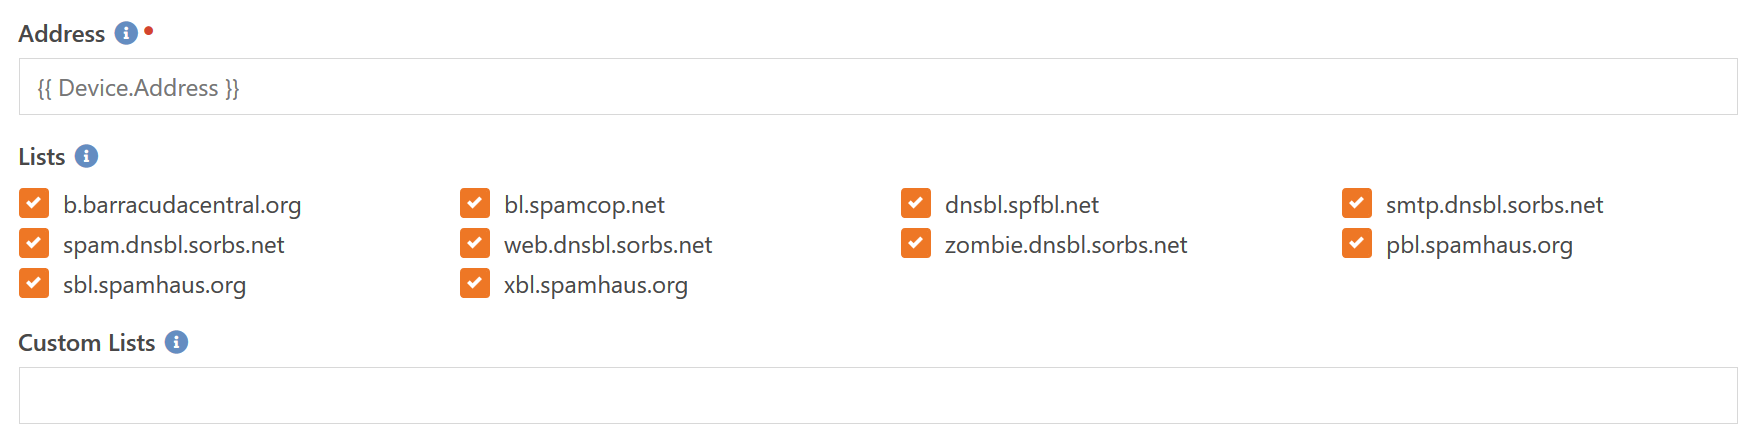
This component allows you to check if your mail server is present on one or more DNS Blacklists. These are free lists that many mail servers use to determine whether or not an incoming message is spam or not. If the sending server is listed in one of the lists then many mail servers will reject the message.
Whether or not you run your own on-premise mail server to sending e-mail or use a mail provider like Mailgun or SendGrid, you can configure a service check with the IP address (or DNS name) of your mail server and monitor if it is on any spam blacklists. If so you can then follow up and determine why and work to get it removed. This allows you to stay ahead of the game and not find out you have been blacklisted after people start complaining they are not getting your e-mails - which usually happens some time after you got blacklisted.
You can choose from the existing list of possible DNS blacklists to query (these are the most common) or if you want to query against one or more lists that are not currently options, you can enter them in the Custom Lists field. These would be entered as one or more comma separated DNS list names.
DNS Lookup
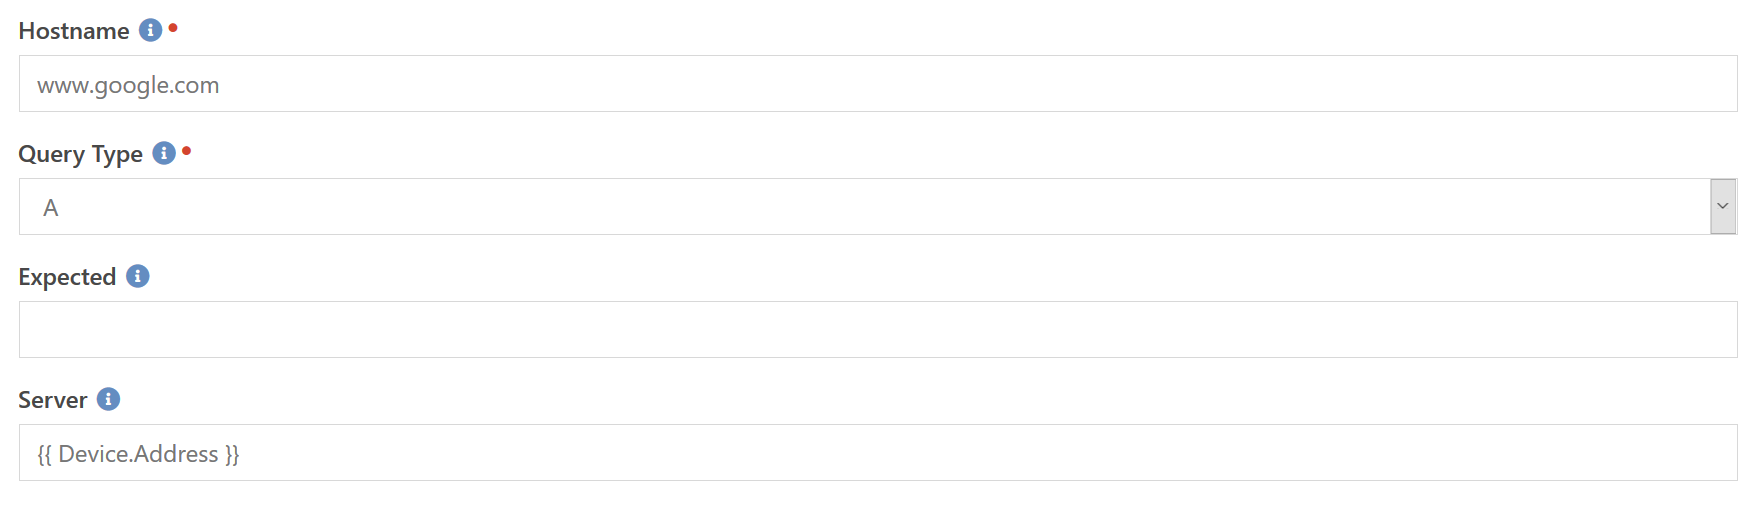
This component allows you to configure a generic DNS lookup test. If you want to ensure that a specific hostname always resolves to a particular IP address you can set that up here. You can also configure it to just ensure that the name resolves to something rather than erroring out. This type of configuration helps you ensure that your DNS server is working at all so that you can investigate why it stopped responding to DNS queries.
The Hostname is the DNS name you want to resolve back to an IP address. Query Type allows you to select between an IPv4 A and an IPv6 AAAA lookup. If you want to verify the result against a specific, expected, value, then you can enter it in the Expected field. By default the component will use the default DNS server, but you can override that by specifying the name or IP address of the DNS server you wish to query in the Server field.
Currently only A and AAAA records are supported. We may include support for other query types in the future such as PTR and TXT.
HTTP Certificate
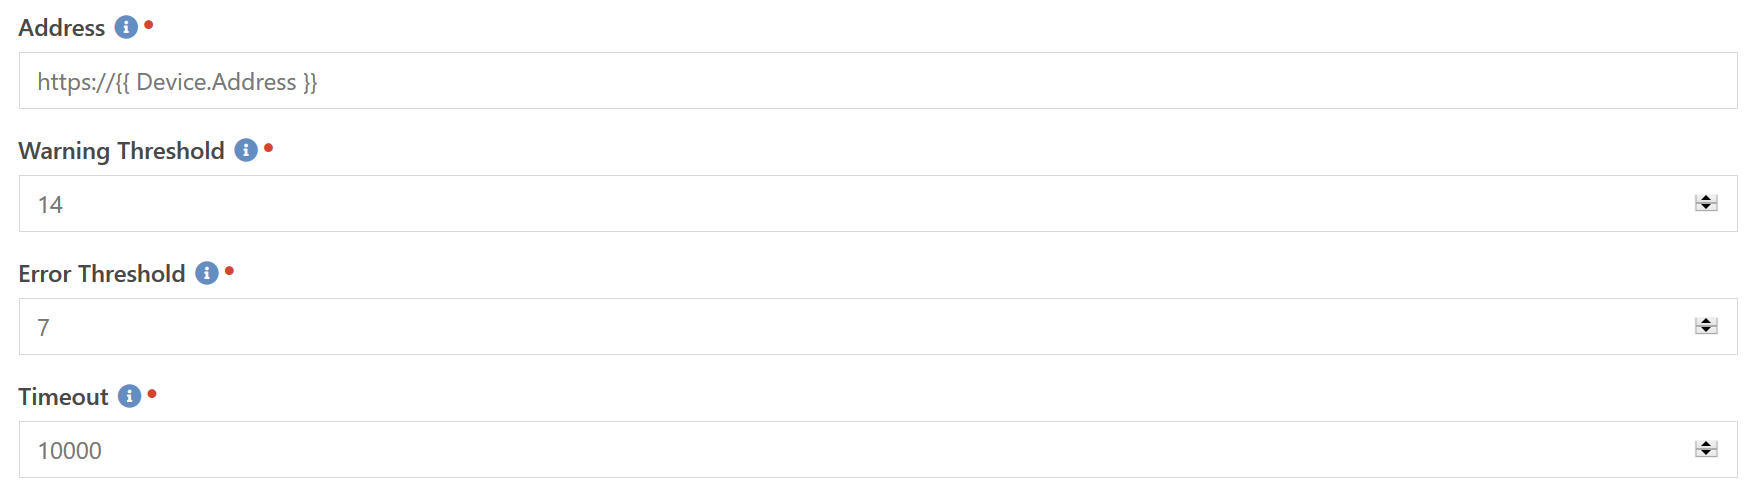
Hopefully we all have our sites secured with an SSL certificate. Hopefully we also have some sort of automated renewal process in place, like using the Acme Certificate plugin. But sometimes we can't use automated renewal. Or maybe you want to monitor the SSL certificates of a non-Rock server or device. This component allows you to check if the SSL Certificate for the given web address is valid and not expiring too soon.
The URL checked is specified by the Address setting and must include the https:// prefix to work correctly. If the time until expiration is less than the Warning Threshold or Error Threshold values, as specified in days, then the check will enter the Warning and Error states respectively. The Timeout value allows you to specify how long to wait for the server to respond and is specified in milliseconds. This helps prevent the check from taking a really long time to report a failure if the server is offline or otherwise not responding in a timely manner.
The component currently checks both the expiration date as well as the validity of the certificate. Meaning if you try to check a self-signed certificate it will report an error because it will be treated as not valid. This also means if the certificate is for www.rocksolidchurchdemo.com but you put https://rock.rocksolidchurchdemo.com in the Address field it will also report an error because the names do not match (normally you would have both names listed in your certificate though). In the future we may add an option to only check the expiration date.
HTTP Response
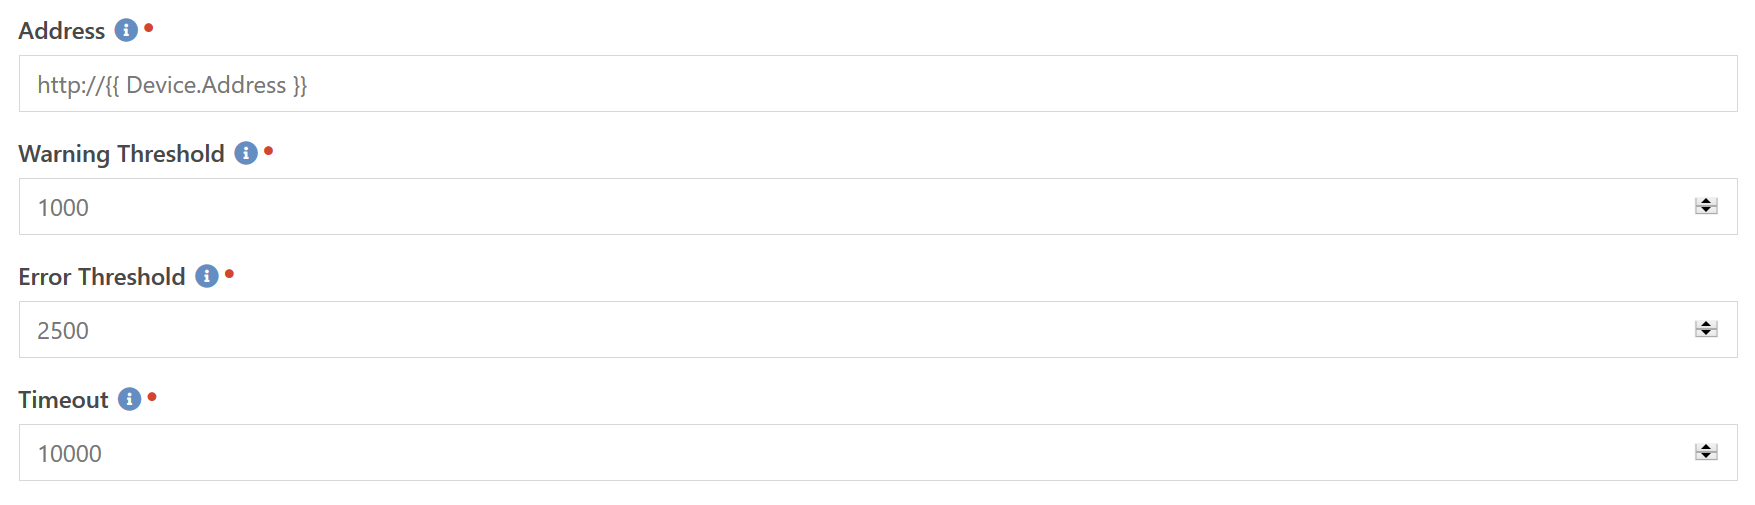
This component will test to make sure the given URL is responding in a timely manner. It does not care what the actual content returned is, as long as it is indicated by a 2xx success code from the server. You specify the Warning Threshold and Error Threshold values in milliseconds, and if the server takes longer than those values to respond then the check enters a Warning or Error state respectively. The Timeout specifies how long to wait for a response before giving up and recording it as a timeout.
The URL queried is specified by the Addresss field. It can be either an http:// or https:// address. Additionally, you don't need to limit it to just the root page of the site. If you have a decent amount of logic on a specific page of your site that takes a bit of time to process, you can setup a check to target that one page and make sure the time to process hasn't crept up to an unnacceptible level.
ICMP Ping
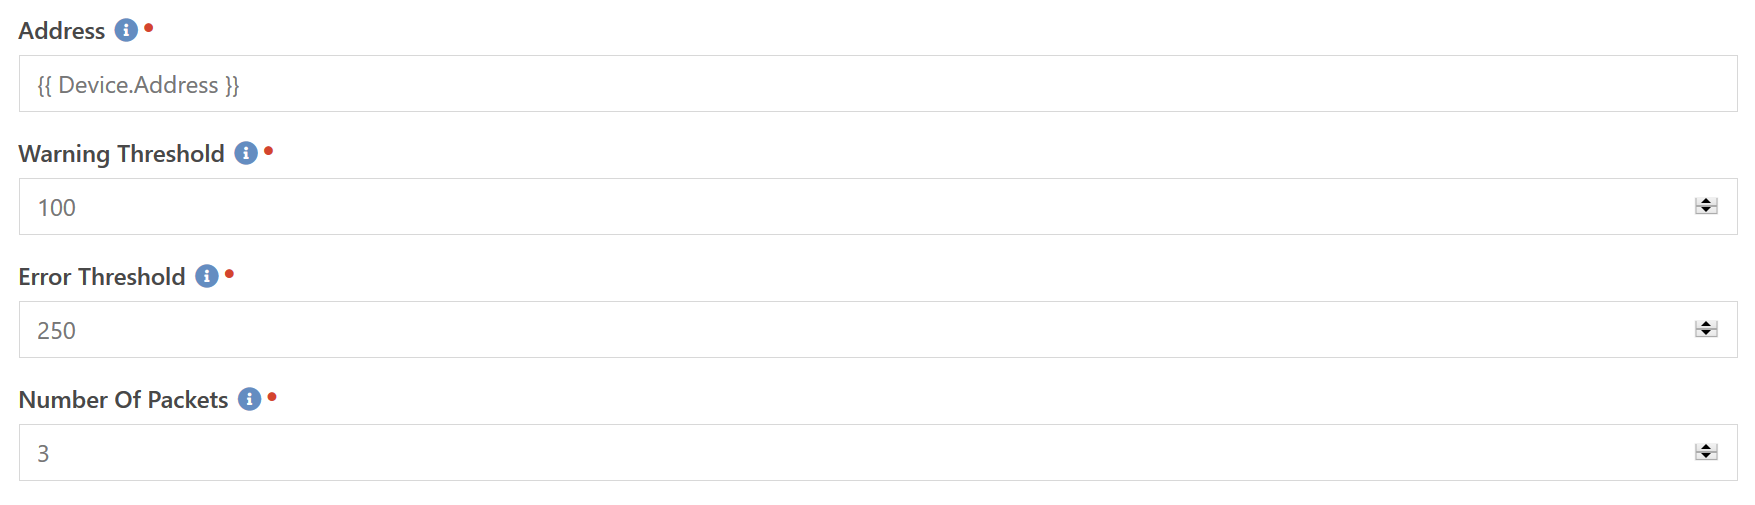
This is the most basic component we have. It simply tests if a device is "alive" by sending what is called a PING packet to the device. Normally a device will respond and you use the time difference to determine if there is a network problem between the two devices. A device is not required to respond to a Ping, and many firewalls (for example Azure's firewall) actually block them. But if it is a device on your own network, most likely it will respond to a Ping.
So with this you can monitor devices to see if they are online and plugged into the network. This is often helpful with devices that are expected to be on and plugged in 24 hours a day, such as servers, printers, switches, etc.
The Address contains the hostname or IP address of the device to be pinged. If the response time is greater than the Warning Threshold or Error Threshold, specified in milliseconds, then the check will return a Warning or Error state respectively. The Number of Packets allows you to specify how many packets to send and receive. The average response time of all packets will be used in calculating the round trip time.
NRPE Value
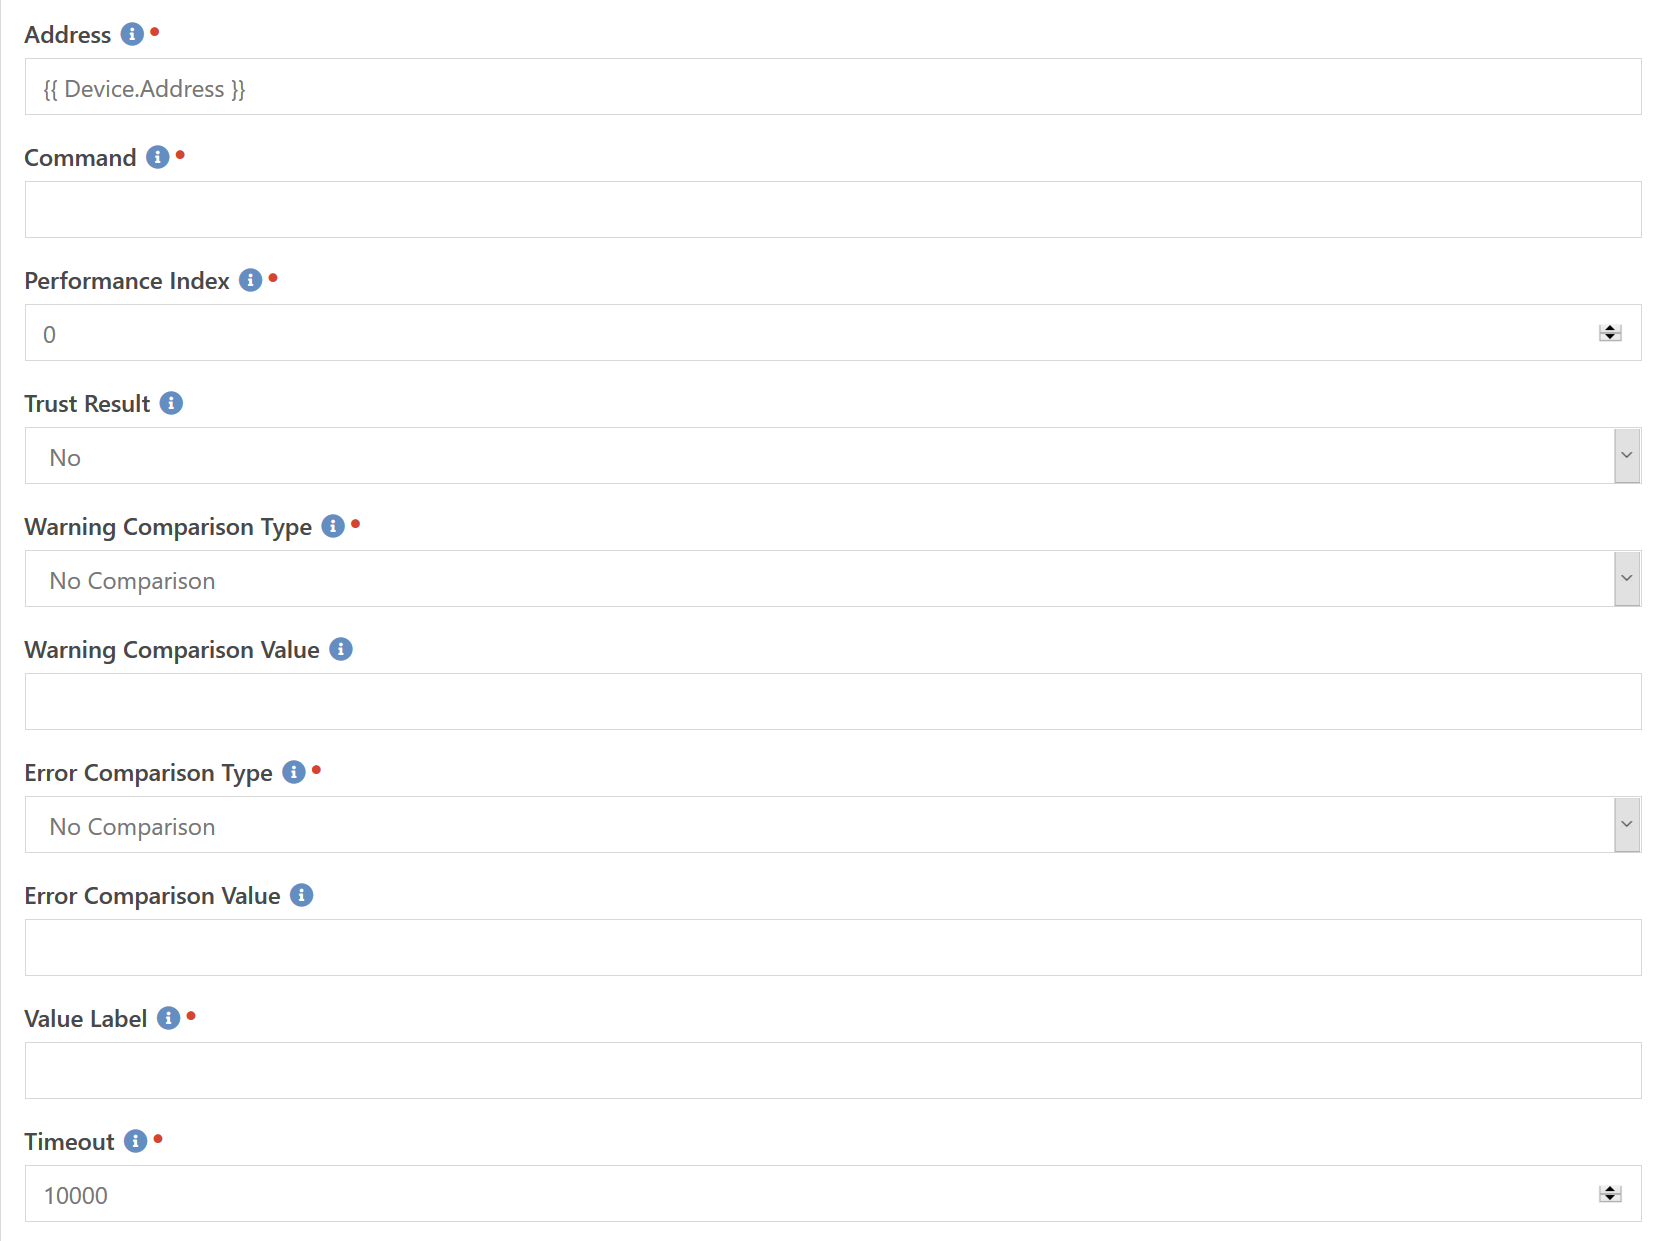
Many organizations that already do some sort of monitoring already have pre-existing Nagios-style checks on their servers. Many of these operate over the NRPE protocol. If you have these checks installed, or plan to install them for better monitoring of your servers, you can use this component to check the state of those checks.
The Address field contains the hostname or IP address to be contacted to perform the check. After connecting it will send the Command field as the check to be performed and wait for the results. You can specify how long to wait by the Timeout field which is the number of milliseconds before it gives up.
Nagios checks are capable of returning multiple performance index values. For example, their version of an ICMP Ping check returns two performance values: The round trip time, and the packet loss percentage. We only support accessing one performance index so you specify which one to retrieve with the Performance Index field. Normally these are orderd by importance so the first index (zero) is usually the one you want.
Another thing that Nagios checks do is return their own state of Ok, Warning and Error. This is based on the internal configuration. If you want to trust these results as truth then you can set the Trust Result to Yes. Doing so will ignore any comparison values you may enter.
Assuming you don't trust the result, you can specify a warning comparison type and value as well as an error comparison type and value. If the returned value matches the Warning Comparison Type and the Warning Comparison Value then the check is put into the Warning state. If the returned value matches the Error Comparison Type and the Error Comparison Value then the check is put into the Error state.
Finally, since we don't know what kind of value is being returned (temperature, disk space, etc.) we don't know what type of label to use when identifying the value. You will need to enter a Value Label to identify those values. For example, if you are running a check on how many days the the device has been running, you would enter day in that field. It will automatically be pluralized as needed and will result in a final text string that looks something like 23 days.
Plugin Updates
This is a fun component. It allows you check if any of the plugins you have installed have an update available. This only checks plugins that are actually installed on the server and are capable of being upgraded. This means if a plugin has an update but it requires a newer version of Rock than you have installed, it is not counted.
Currently there are no configurable options for this component. It will automatically enter a warning state if there are plugin updates available. There is also a three day delay before an update is considered available. This allows time for the developer to do a final test install from the rock shop and have time to pull it if problems were discovered with the packaging.
[!IMPORTANT]
This component must be run on the Rock server itself, which means you may need to specify the Rock server in the Collector Override when you attach it to a device profile.
Printer State
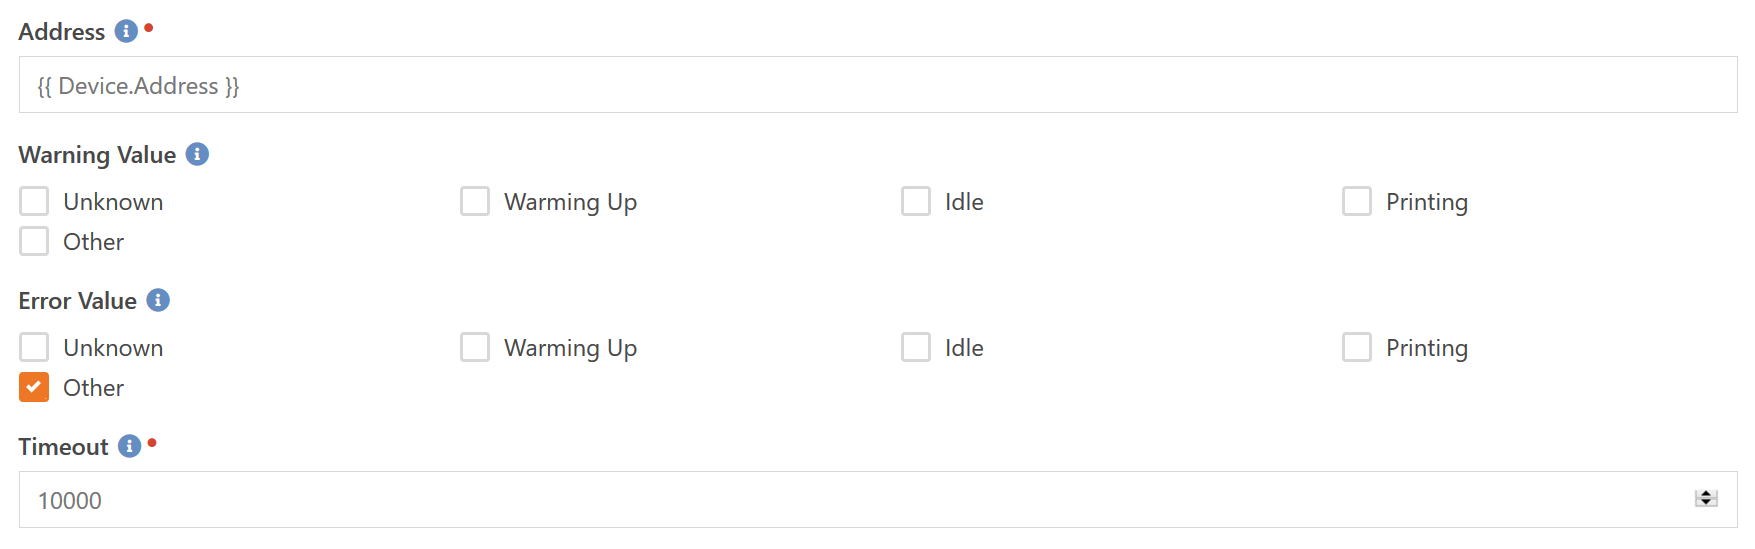
Depending on how your printers operate, this could either be a very useful component or it could also be useless to you. Basically, every printer reports a very generic state on itself via SNMP. The normal states are: Warming Up, Idle, and Printing. Usually if the printer is in the Unknown or Other state it means an error has occurred. But since there is no specification for when the different states are returned it really comes down to you testing with your printers and seeing if this component will give the results you need.
Configuration is straighforward. Simply specify the address of the printer and which states you want to receive a warning an error alert on.
Printer Status
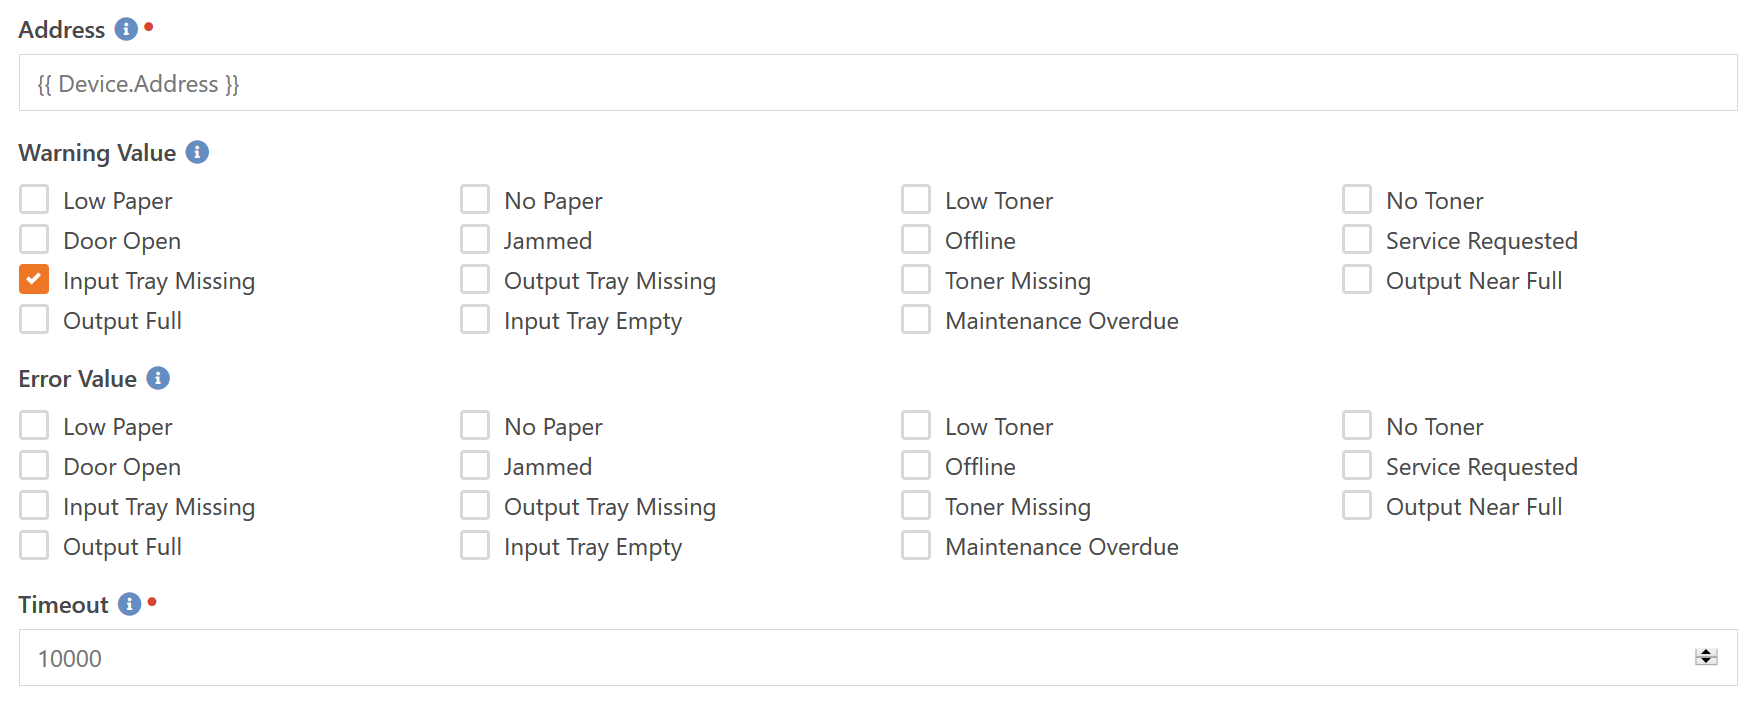
Most printers provide somewhat useful status flags via SNMP. This component will allow you to check those status flags and initiate alerts under certain conditions. For example, you may want to setup an alert for your helpdesk person when a printer's paper runs low so that they can go fill it up before it stops printing.
A printer can return no status values (indicating everything is probably OK), or it can return one or more status values. So it is perfectly valid for the status value returned by the printer to contain both "Low Paper" and "Low Toner" at the same time.
Bear in mind that not all printers provide the indicated status values. These are only the possible values that are defined in the specification. For example, a small home printer will probably never return the "Low Paper" status as that requires additional sensors. Many will just go from "normal" to "No Paper". Larger office printers will likely have the "Low Paper" sensors.
Another thing to consider, especially with larger units like copiers and such, is that they will return a tray-related condition if any tray meets that condition. So if you have 4 trays with Plain Letter and the unit is configured to use all 4 trays in sequence and the first tray runs out, it will trigger a "No Paper" condition even though it will still print just fine (because the other 3 trays have paper). Other conditions are more likely to cause a full stop in printing, such as "Jammed", "Toner Missing", etc.
SNMP Uptime
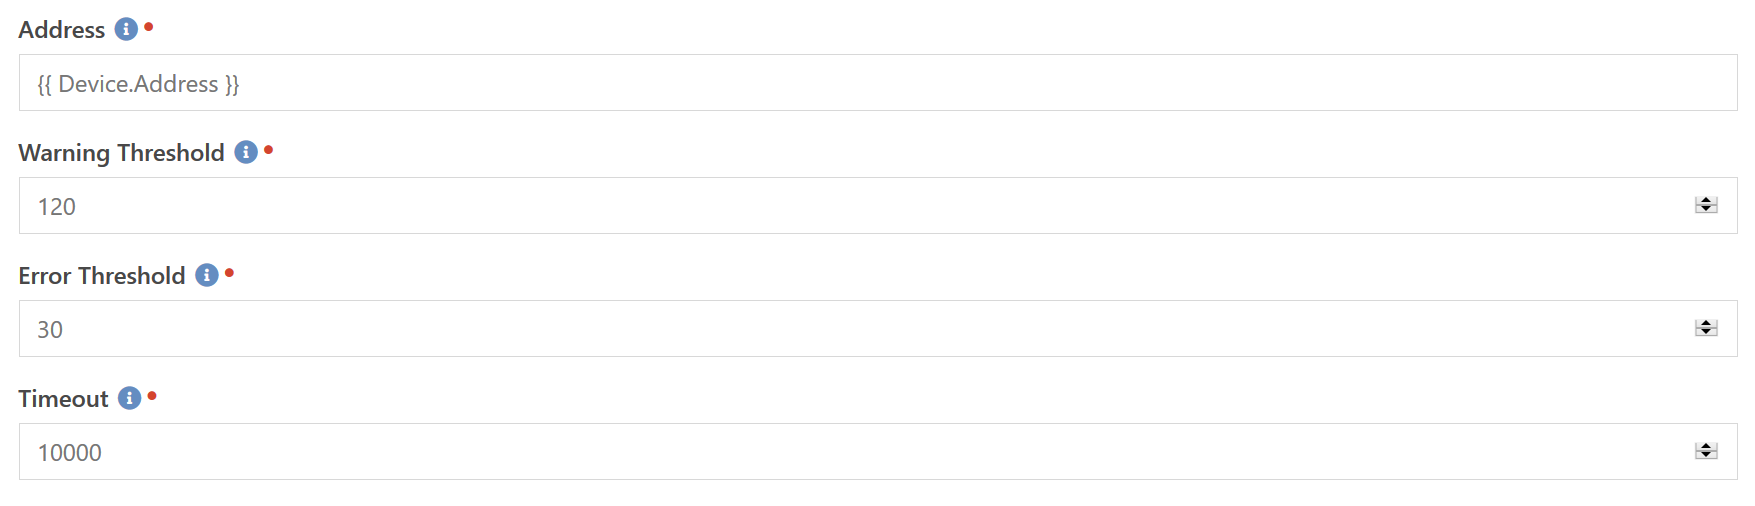
If you are monitoring a network device such as a printer, network switch, UPS, etc. then it probably supports being monitored by a protocol called SNMP. Working with SNMP can be tricky and while there is a component for checking any arbitrary value we gave you the most common one you will be using as a self-contained component. This comoonent will query the device via SNMP and check how long it has been up and online. If it is below a certain threshold (indicating a recent reboot) then it will enter either a Warning or Error state.
You specify the hostname or IP address to connect to by the Address field. If the returned system uptime is less than the minutes specified inWarning Threshold then it will enter a Warning state. If the system uptime is less than the Error Threshold specified minutes then it will enter an Error state. The Timeout indicates the number of milliseconds to wait for a response from the device.
It should be noted that just because a device supports SNMP does not mean it will automatically respond to SNMP queries. You will need to configure the SNMP Settings to match the device's own configuration otherwise you will probably get timeout errors.
SNMP Value
So we just talked about the SNMP Uptime component. That is great if all you want to know is how long the device has been running. But SNMP actually exposes a lot of data for you to monitor. For example, most printers will report how much toner they have left, or how full the paper trays are. A network switch will often report the internal temperature. Most devices also report an "overall status" that wouldn't tell you specifically what is wrong, but would basically let you see remotely that pesky warning indicator on the switch stuffed in the closet on the other side of the building.
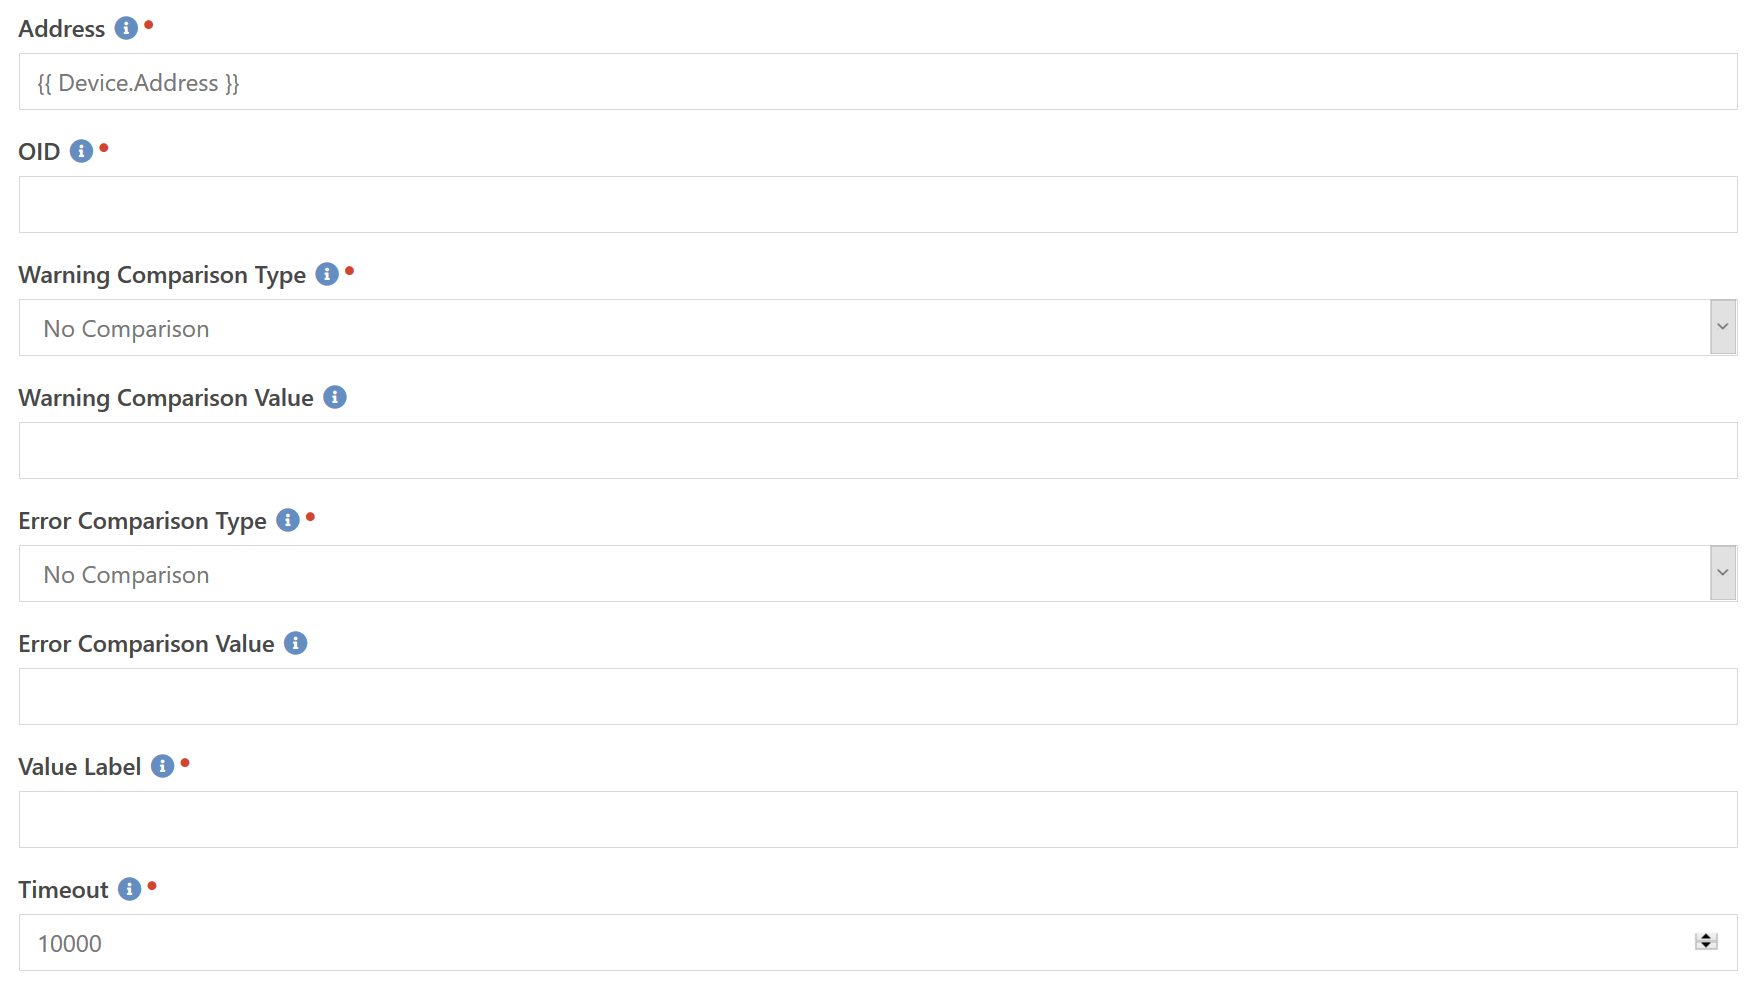
To achieve that, you have this component. This is probably one of the most difficult components to set up, purely becuase there is no standard to which OID number a device will use to transmit it's data. You have to find these OID numbers in technical manuals or by trial and error. However, once you know it, you can re-use that same OID number to check other devices of the same make and model.
The Address, like most other checks, specifies the hostname or IP address to connect to. The OID is where you specify which value you are interested in, and is expressed as a long integer string separated by periods, such as 1.3.6.1.2.1.1.1.0. To ensure that the check does not sit waiting forever for a response, you can specify a timeout in milliseconds in the Timeout field.
Next you can specify a warning comparison type and value as well as an error comparison type and value. If the returned value matches the Warning Comparison Type and the Warning Comparison Value then the check is put into the Warning state. If the returned value matches the Error Comparison Type and the Error Comparison Value then the check is put into the Error state. Since SNMP values can be numerical or string values, the comparison types include two string comparisons. So if you are querying a string value that might contain the word "fail" if a problem exists, you can specify Contains fail to detect that condition.
Finally, since we don't know what kind of value is being returned (temperature, disk space, etc.) we don't know what type of label to use when identifying the value. You will need to enter a Value Label to identify those values. For example, if you are running a check on the temperature of the device, you would enter degree in that field. It will automatically be pluralized as needed and will result in a final text string that looks something like 96 degrees.
SQL Query
This is another fun component that you can use to do lots of things with. Since a SQL query has access to everything in your database, you can also query on everything. Here are a few ideas:
- Number of pending Email messages to be sent
- Number of pending SMS messages to be sent
- Number of "Web Prospects" in the database that need to be dealt with
- How many active workflows that are more than 90 days old
- How many connections are more than 60 days old
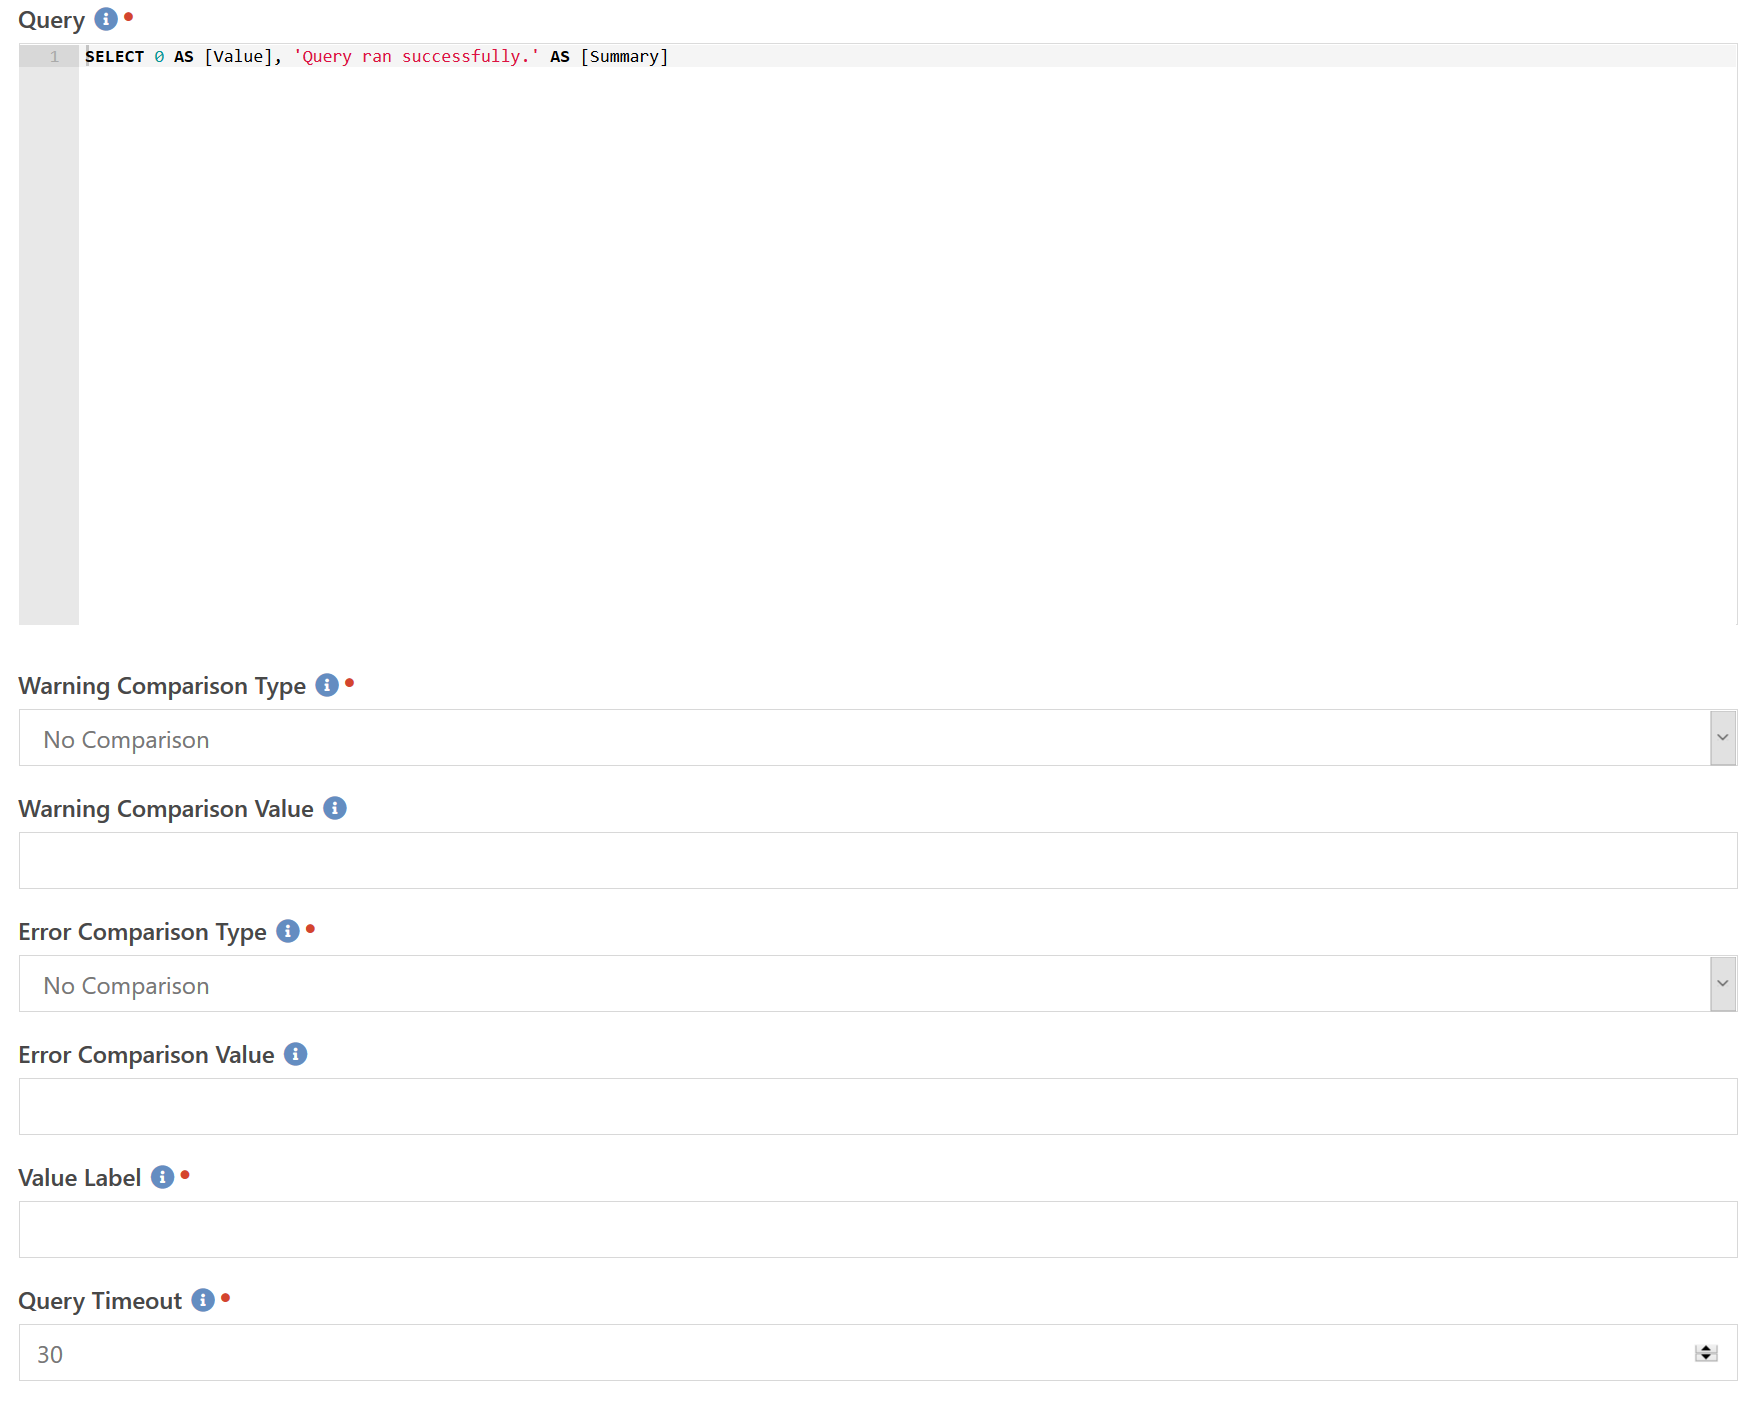
Configuration is fairly straight forward. You simply enter a SQL query that returns a single row of data. One column must be named Value and will be used as the value for comparison and for historical charting. You may also specify a column of Summary which will be used as the summary text if the check returns an OK status. You should design your queries to be fast, but just in case you have on that may take a long time to run you can specify a timeout in seconds in the Query Timeout field.
Next you can specify a warning comparison type and value as well as an error comparison type and value. If the returned value matches the Warning Comparison Type and the Warning Comparison Value then the check is put into the Warning state. If the returned value matches the Error Comparison Type and the Error Comparison Value then the check is put into the Error state. Since SNMP values can be numerical or string values, the comparison types include two string comparisons. So if you are querying a string value that might contain the word "fail" if a problem exists, you can specify Contains fail to detect that condition.
Finally, since we don't know what kind of value is being returned (temperature, disk space, etc.) we don't know what type of label to use when identifying the value. You will need to enter a Value Label to identify those values. For example, if you are running a check on how many people are in the database, you would enter person in that field. It will automatically be pluralized as needed and will result in a final text string that looks something like 8,419 people.
To give you an idea of the kinds of things you can do, this is the query we use to monitor the CPU usage on our Azure SQL instance (note: this only works on Azure and not on-premise SQL).
SELECT
    CAST(AVG(avg_cpu_percent) AS decimal(18, 2)) AS [Value],
    'Currently using ' + CAST(CAST(AVG(avg_cpu_percent) AS decimal(18, 2)) AS varchar(10)) + '% of ' + CAST(MAX(dtu_limit) AS VARCHAR(10)) + ' DTUs.' AS [Summary]
FROM sys.dm_db_resource_stats
WHERE [end_time] >= DATEADD(MINUTE, -5, GETDATE())
A bit of information on what the above is doing. An Azure SQL database stores statistical data in the sys.dm_db_resource_stats table. These are 30 second averages. Because we have the check configured to run every five minutes, we are taking all rows from the past five minutes and averaging them all together. This gives us a five minute average value. Next we want a pretty summary string so we take that same five minute average and also pull the DTU size the database is currently configured for. The final result is a summary string like Currently using 4.28% of 20 DTUs.
[!IMPORTANT]
This component must be run on the Rock server itself, which means you may need to specify the Rock server in the Collector Override when you attach it to a device profile.
[!WARNING]
Usually these SQL queries you will be running are not things you need to update every five minutes. Update your Check Interval with an appropriate value. For example if you are monitoring the number of people in the Web Prospects role, you probably don't need to update that value every five minutes. Configure it to run hourly, or maybe even daily.
TCP Port Open
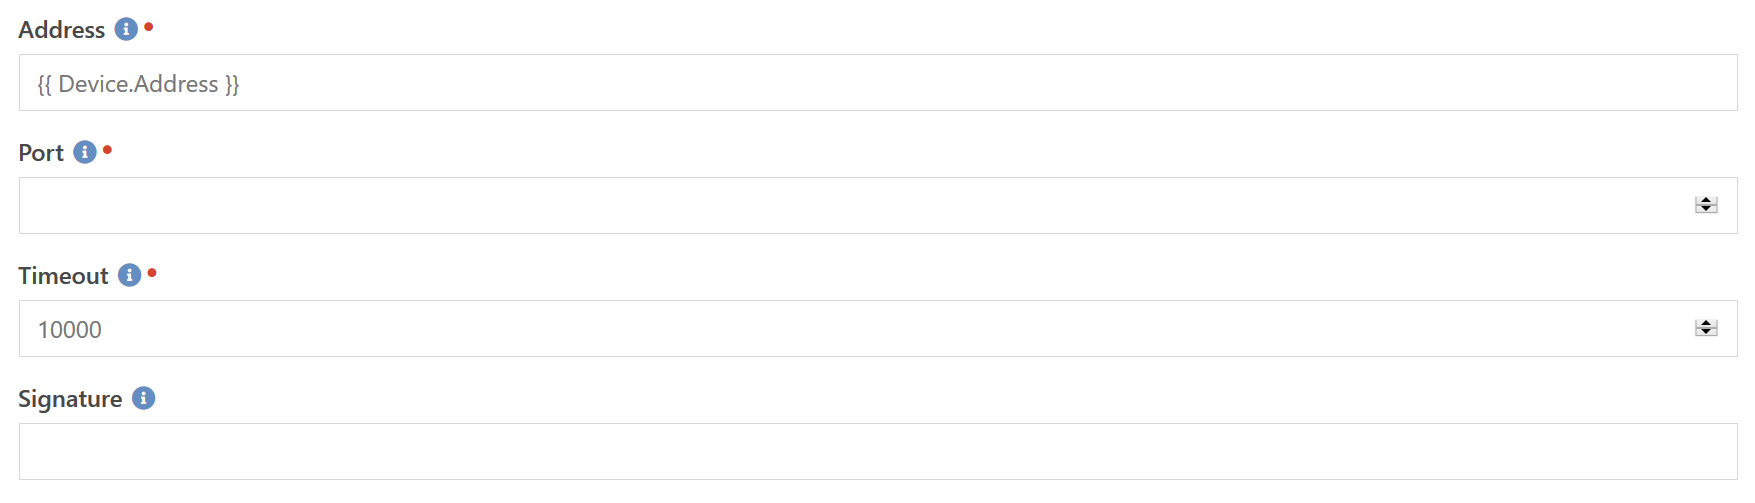
Wouldn't it be nice if you could monitor your Exchange server to ensure it hadn't crashed? Or your Linux hosts to make sure they are still responding to SSH connections correctly? That is exactly what the TCP Port Open component is for. At it's most basic level, it ensures that it can successfully connect to the host on the given port number. These are specified by the Address and Port fields. You can also specify the time in milliseconds to wait for a connection with the Timeout field.
But just connecting to the port doesn't necessarily tell you things are working correctly. Most services send some form of "hello" string when you first open a connection to them. If the port you are connecting to is one of these, then you can enter a value in the Signature field to match against that text data it sends. This is a regular expression field which means you can do some pretty advanced matching. To see a few examples of how this works, take a look at the SSH Service, SMTP Service and IMAP4 Service checks.