The Project Dashboard block is a portfolio-wide status view. Instead of focusing on one project's tree, it gives leaders and program managers a quick answer to questions like how much work is active, what is overdue, what completed recently, and where the pressure is across the whole portfolio. The plugin ships it as its own page in the Projects area.
This block is most useful for people who need a quick health check across many projects rather than a detailed look at one project. It works well for team leads, directors, or anyone who needs to spot overdue work, recent completions, and overall delivery pressure without opening each project individually.
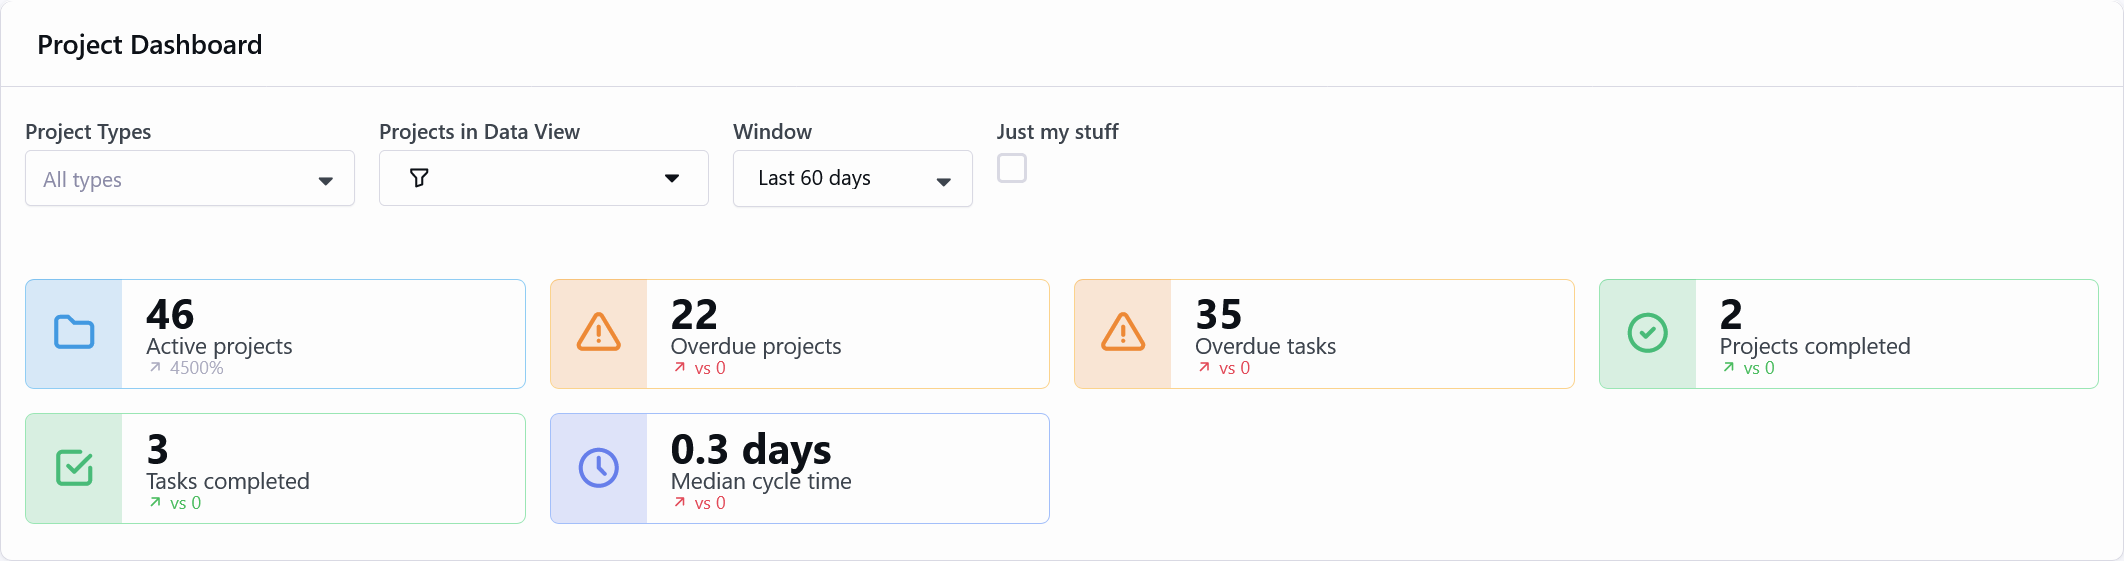
Scope and Filters
Because the filter state lives in the URL, this page is also practical as a shareable working view. An administrator or leader can narrow the dashboard to a set of project types or a data view and then bookmark that specific slice of the portfolio for later, or send it to someone else as a starting point.
- The block is cross-project rather than tied to one project context.
- Filter state lives in the URL, which means a filtered dashboard can be bookmarked or shared as a link.
- Project Types limits the view to one or more project types.
- Projects in Data View lets you scope the dashboard through a Rock Data View when project type alone is not enough.
- Window picks a rolling 30-, 60-, or 90-day lookback for time-based metrics.
- Just my stuff narrows the view to work related to the current viewer. Because it is viewer-relative, a shared link with this setting enabled shows each recipient their own work rather than the sender's work.
What It Shows
The widget groups answer slightly different management questions. The KPI tiles answer "what is the current situation?" The throughput chart answers "have we been shipping work consistently?" The lists answer "which specific projects deserve attention right now?"
- KPI tiles for active projects, overdue projects, overdue tasks, projects completed, tasks completed, and median cycle time, each compared to the prior period of the same length.
- A throughput chart that shows weekly completions for projects and tasks across the selected window.
- Short lists for overdue projects and recently completed projects, each linking through to the project detail page.
- Block settings let an administrator show or hide the tile group, chart, and lists independently.
The numbers are intentionally built from the project's existing request, due, completed, and cancelled dates rather than reconstructing history from activity log notes. That keeps the dashboard fast while still making the trend arrows and point-in-time counts meaningful.